WPF免费绘图库推荐
InteractiveDataDisplay是Microsoft开发的一组 WPF 控件,用于在 WPF 应用程序中交互式显示数据。它支持折线图、气泡图、热图和其他在科学软件中非常常见的复杂二维图。GitHub 页面上的最后一次提交是从 2018 年开始的,最后一次发布的 NuGet 包InteractiveDataDisplay.WPF是从 2017 年开始的,所以这个项目似乎不再维护。
平台支持
官方包只支持.NET Framework: NuGet包(1.0.0版)不支持.NET Core。更具体地说,NuGet 包具有复杂的过时依赖项,而官方 NuGet 包仅适用于开箱即用的.NET Framework 4.5.2
对 .NET Core 的非官方支持: 2019 年的第34期链接到Jeff Mastry的支持 .NET Core 的分支,但它在 NuGet 上不可用,并且微软从未对此问题作出回应。
互动性
- 左键单击拖动以平移
- 左键单击并拖动轴以平移该轴
- 滚轮缩放
- 双击以使轴限制适合数据
快速开始
- 创建 .NET Framework WPF 应用程序
- 添加
InteractiveDataDisplay.WPFNuGet 包 - 将图表控件添加到您的布局
Add()图表类型
主窗口.xaml
生成样本数据
此代码生成我们可以练习绘图的随机数据
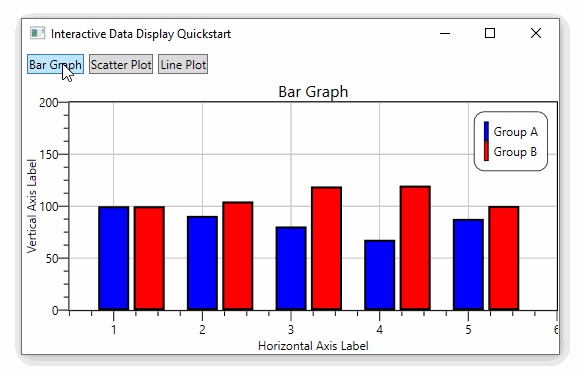
private Random rand = new Random(0);private double[] RandomWalk(int points = 5, double start = 100, double mult = 50){ // return an array of difting random numbers double[] values = new double[points]; values[0] = start; for (int i = 1; i < points; i++) values[i] = values[i - 1] + (rand.NextDouble() - .5) * mult; return values;}private double[] Consecutive(int points, double offset = 0, double stepSize = 1){ // return an array of ascending numbers starting at 1 double[] values = new double[points]; for (int i = 0; i < points; i++) values[i] = i * stepSize + 1 + offset; return values;}条状图
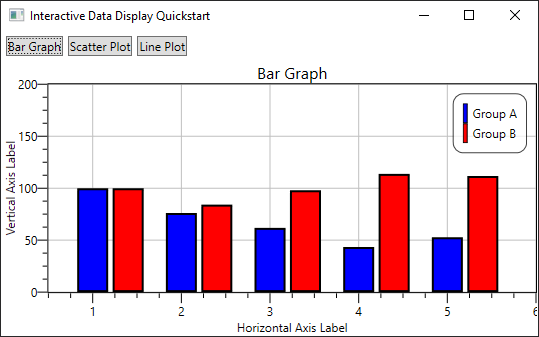
// generate some random Y dataint pointCount = 5;double[] xs1 = Consecutive(pointCount, offset: 0);double[] xs2 = Consecutive(pointCount, offset: .4);double[] ys1 = RandomWalk(pointCount);double[] ys2 = RandomWalk(pointCount);// create the series and describe their stylingvar bar1 = new InteractiveDataDisplay.WPF.BarGraph(){ Color = Brushes.Blue, Description = "Group A", BarsWidth = .35,};var bar2 = new InteractiveDataDisplay.WPF.BarGraph(){ Color = Brushes.Red, Description = "Group B", BarsWidth = .35,};// load data into each seriesbar1.PlotBars(xs1, ys1);bar2.PlotBars(xs2, ys2);// add the series to the gridmyGrid.Children.Clear();myGrid.Children.Add(bar1);myGrid.Children.Add(bar2);// customize stylingmyChart.Title = $"Bar Graph";myChart.BottomTitle = $"Horizontal Axis Label";myChart.LeftTitle = $"Vertical Axis Label";myChart.IsAutoFitEnabled = false;myChart.LegendVisibility = Visibility.Visible;// set axis limits manuallymyChart.PlotOriginX = .5;myChart.PlotWidth = 5.5;myChart.PlotOriginY = 0;myChart.PlotHeight = 200;散点图
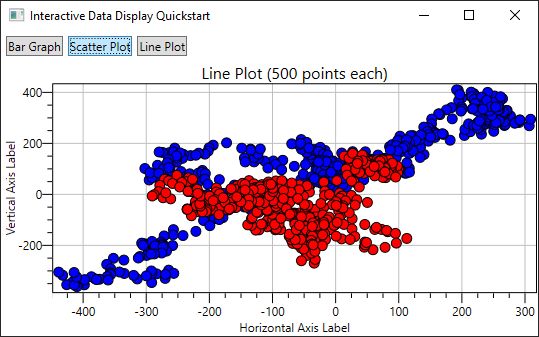
// generate some random X and Y dataint pointCount = 500;double[] xs1 = RandomWalk(pointCount);double[] ys1 = RandomWalk(pointCount);double[] xs2 = RandomWalk(pointCount);double[] ys2 = RandomWalk(pointCount);double[] sizes = Consecutive(pointCount, 10, 0);// create the lines and describe their stylingvar line1 = new InteractiveDataDisplay.WPF.CircleMarkerGraph(){ Color = new SolidColorBrush(Colors.Blue), Description = "Group A", StrokeThickness = 1};var line2 = new InteractiveDataDisplay.WPF.CircleMarkerGraph(){ Color = new SolidColorBrush(Colors.Red), Description = "Group B", StrokeThickness = 1};// load data into the linesline1.PlotSize(xs1, ys1, sizes);line2.PlotSize(xs2, ys2, sizes);// add lines into the gridmyGrid.Children.Clear();myGrid.Children.Add(line1);myGrid.Children.Add(line2);// customize stylingmyChart.Title = $"Line Plot ({pointCount:n0} points each)";myChart.BottomTitle = $"Horizontal Axis Label";myChart.LeftTitle = $"Vertical Axis Label";myChart.IsAutoFitEnabled = true;myChart.LegendVisibility = Visibility.Hidden;线图
我可以显示大约 10 万行点的行,性能开始受到很大影响。
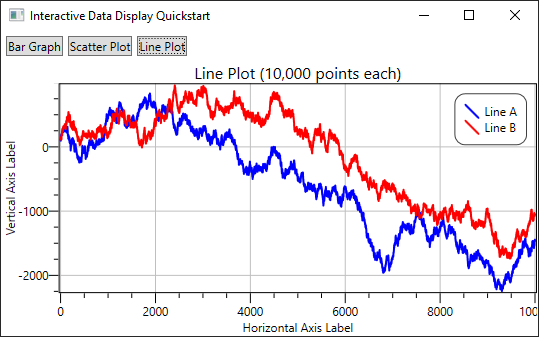
int pointCount = 10_000;double[] xs = Consecutive(pointCount);double[] ys1 = RandomWalk(pointCount);double[] ys2 = RandomWalk(pointCount);// create the lines and describe their stylingvar line1 = new InteractiveDataDisplay.WPF.LineGraph{ Stroke = new SolidColorBrush(Colors.Blue), Description = "Line A", StrokeThickness = 2};var line2 = new InteractiveDataDisplay.WPF.LineGraph{ Stroke = new SolidColorBrush(Colors.Red), Description = "Line B", StrokeThickness = 2};// load data into the linesline1.Plot(xs, ys1);line2.Plot(xs, ys2);// add lines into the gridmyGrid.Children.Clear();myGrid.Children.Add(line1);myGrid.Children.Add(line2);// customize stylingmyChart.Title = $"Line Plot ({pointCount:n0} points each)";myChart.BottomTitle = $"Horizontal Axis Label";myChart.LeftTitle = $"Vertical Axis Label";myChart.IsAutoFitEnabled = true;myChart.LegendVisibility = Visibility.Visible;