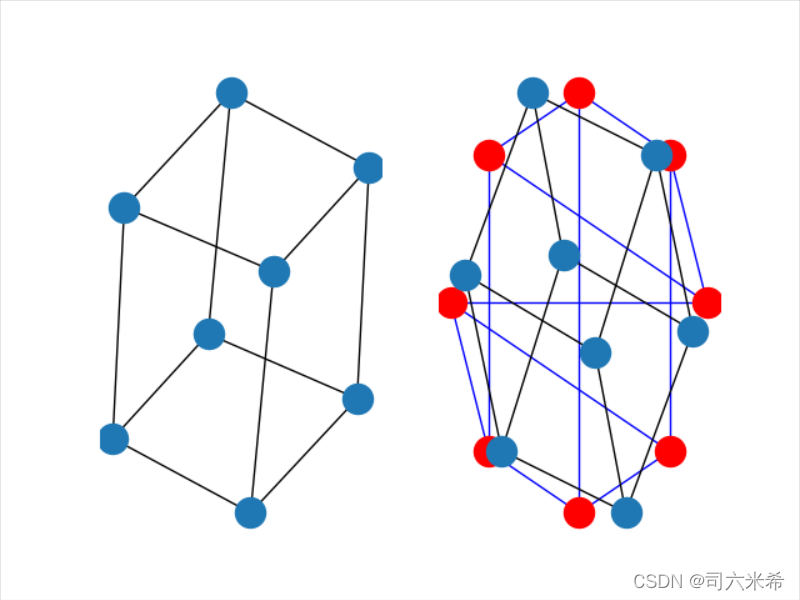
import networkx as nximport matplotlib.pyplot as pltimport mathG=nx.Graph()G.add_edge(1,2)G.add_edge(2,3,weight=0.9)G.add_edge('y','x',function=math.cos)G.add_node(math.cos)elist=[(1,2),(2,3),(1,4),(4,2)]G.add_edges_from(elist)elist2=[('a','b',5.0),('b','c',3.0),('a','c',1.0),('c','b',7.3)]G.add_weighted_edges_from(elist2)G.add_node(1)G.add_nodes_from([2,3])G.add_nodes_from(range(100,110))H=nx.path_graph(10)G.add_nodes_from(H)G=nx.cubical_graph()subax1=plt.subplot(121)nx.draw(G)subax2=plt.subplot(122)nx.draw(G,pos=nx.circular_layout(G),node_color='r',edge_color='b')nx.draw(G)plt.show()