vue项目中ECharts图表库图表引入不显示问题
vue项目中ECharts图表库引入不显示问题
很多小伙伴在vue项目中引入 ECharts图表库不显示非常的苦恼,
在项目中引入 Apache ECharts问题:
Handbook - Apache ECharts <==官方文档
个人简化版本:
1.在vue项目中安装echarts依赖包
npm install echarts --save2. 在项目的main.js中放入:
import * as echarts from "echarts" //引入echarts
Vue.prototype.$echarts = echarts //注册组件
import * as echarts from "echarts" //引入echartsVue.prototype.$echarts = echarts //注册组件2.在需要展示图表的页面xxx.vue中
以下是简单的示例:
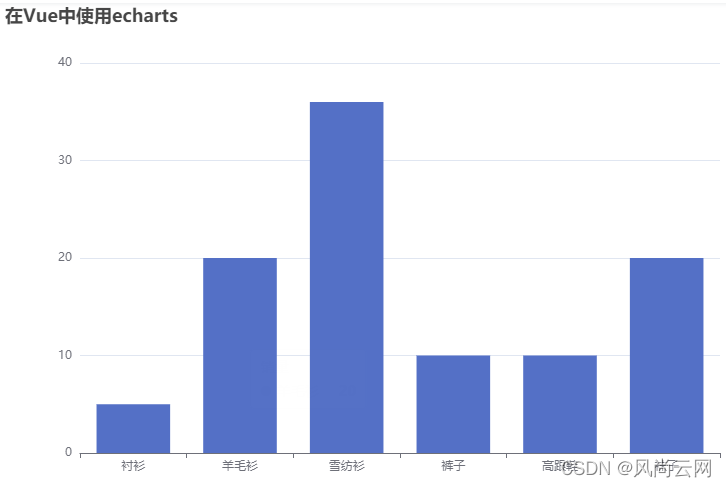
// import * as echarts from 'echarts';export default { name: "eCharts", data() { return { }; }, mounted() { this.drawLine(); }, methods: { drawLine() { // 基于准备好的dom,初始化echarts实例 let myChart = this.$echarts.init(document.getElementById("myChart")); // 绘制图表 myChart.setOption({ title: { text: "在Vue中使用echarts" }, tooltip: {}, xAxis: { data: ["衬衫", "羊毛衫", "雪纺衫", "裤子", "高跟鞋", "袜子"], }, yAxis: {}, series: [ { name: "销量", type: "bar", data: [5, 20, 36, 10, 10, 20], }, ], }); }, },};注意点:一定要设置宽高

