【JavaScript】利用JS实现柱形统计图
CSS代码部分:
* { margin: 0px; padding: 0px; } .box { display: flex; width: 700px; height: 500px; border-left: 1px solid pink; border-bottom: 1px solid pink; margin: 50px auto; justify-content: space-around; /*四个柱子的距离*/ align-items: flex-end; /* 柱子从下对齐 */ text-align: center; } .box>div { display: flex; width: 50px; background-color: pink; /*让第*季度这几个字在.box下显示*/ flex-direction: column; justify-content: space-between; } .box div span { margin-top: -20px; } .box div h4 { margin-bottom: -35px; width: 70px; margin-left: -10px; }JS代码部分:
let arr = [] // 循环季度 一共需要4次 for (let i = 1; i <= 4; i++) { // 将输入的数据存放到数组中 arr.push(prompt(`请输入第${i}季度的数据`)) } document.write(``) //循环四个柱子 for (let i = 0; i < arr.length; i++) { document.write(` ${arr[i]} 第${i + 1}季度
`) } document.write(``) 代码截图:
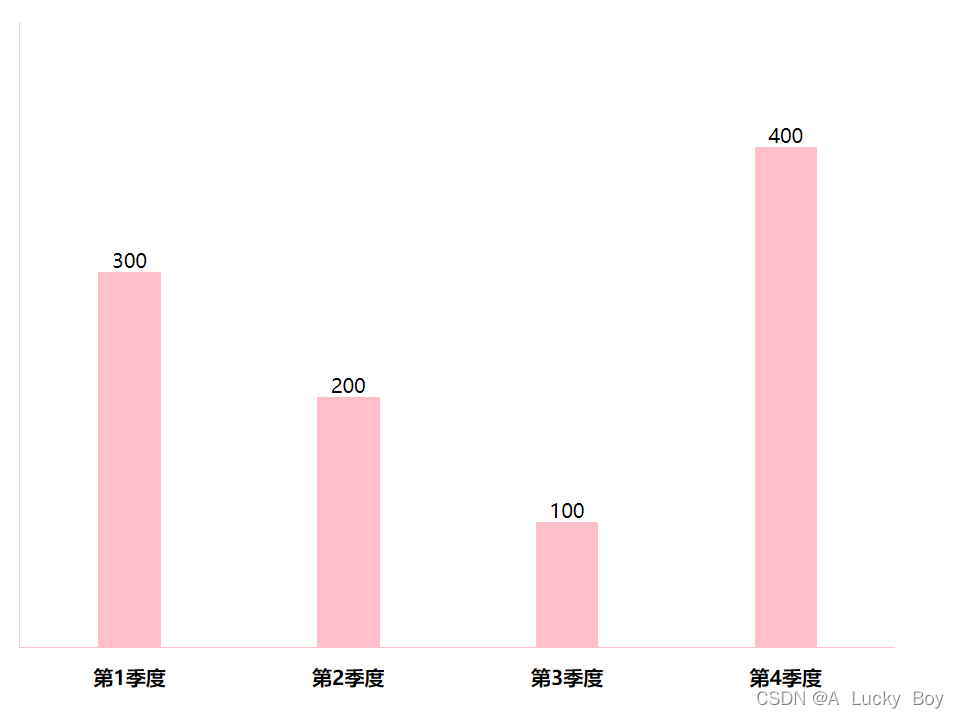
在弹出框中输入数据

最终将数据呈现在柱形图