动态关系图(html,直接可以单独html运行),方便集成项目

🍖🍖🍖🍖🍖🍖🍖🍖🍖 🍖🍖🍖🍖🍖🍖🍖🍖 🍖🍖🍖🍖🍖🍖🍖🍖 🍖🍖🍖🍖🍖🍖🍖🍖 🍖🍖🍖🍖🍖🍖🍖🍖 🍖🍖🍖🍖🍖🍖🍖🍖 🍖🍖🍖🍖🍖🍖🍖🍖 🍖🍖🍖🍖🍖🍖🍖🍖 🍖🍖🍖🍖🍖🍖🍖🍖 🍖🍖🍖🍖🍖🍖🍖🍖 🍖🍖🍖🍖🍖
🍖🍖
🍖🍖🍖
🍖🍖🍖🍖 作者 : 不良使
🍖🍖🍖🍖🍖 潜力创作新星 华为云享专家
🍖🍖🍖🍖🍖🍖 博客记录学习的思路,项目和错误,寻找志同道合的朋友
🍖🍖🍖🍖🍖🍖🍖 如果觉得有帮助记得一键三连 ┗|`O′|┛ 嗷~~
🍖🍖🍖🍖🍖🍖🍖🍖
🍖🍖🍖🍖🍖🍖🍖🍖 🍖🍖🍖🍖🍖🍖🍖🍖 🍖🍖🍖🍖🍖🍖🍖🍖 🍖🍖🍖🍖🍖🍖🍖🍖 🍖🍖🍖🍖🍖🍖🍖🍖 🍖🍖🍖🍖🍖🍖🍖 🍖🍖🍖🍖🍖🍖🍖🍖 🍖🍖🍖🍖🍖🍖🍖🍖 🍖🍖🍖🍖🍖🍖🍖🍖 🍖🍖🍖🍖🍖🍖🍖🍖 🍖🍖🍖🍖🍖🍖🍖
最近做一个项目需要用到可视化(数据传到前端产生可视化界面),但是网上的要不就是残码,要不就是要付费的,为我带来很多困扰,为了摆脱这样的困扰,我将我用到的一些可视乎分享给大家,希望社区越做越好。

先上图:
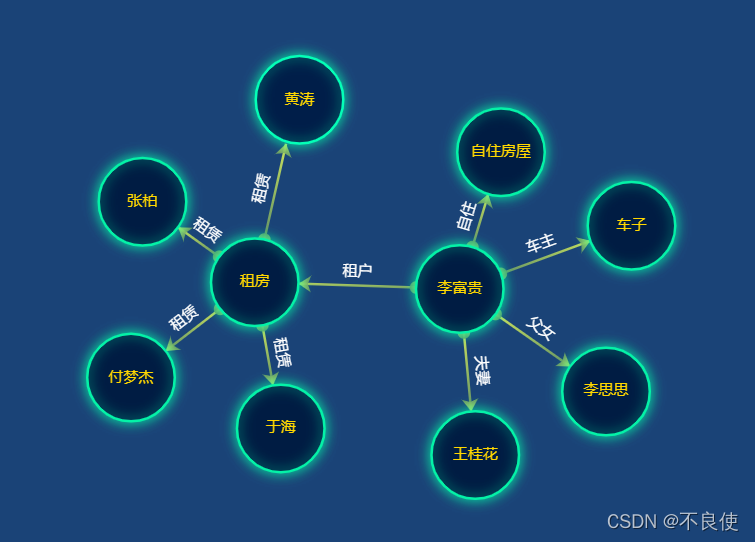
这些图都是可以拖动的,每个全都是可以拖动的,拖动一个其他布局也发生相应的改变。因为博主暂时技能有限,弄不出静态图片,大家凑合着看吧😂😂。下面直接上代码,不闲聊。
<html lang="en"><head> <meta charset="UTF-8"> <title>Title</title> <script src="https://assets.pyecharts.org/assets/echarts.min.js"></script></head><body><div id="garps" class="container" style="width: 800px;height: 600px"><script src="https://assets.pyecharts.org/assets/main.js"></script> <script> var chart_b859ef36a1b245b2b1eb24efe9b62146 = echarts.init( document.getElementById('garps'), 'white', {renderer: 'canvas'}); option = { backgroundColor: '#1a4377', grid: { left: '10%', top: 60, right: '10%', bottom: 60, }, toolbox: { feature: { saveAsImage: {} } }, series: [{ type: 'graph', layout: 'force', force: { repulsion: 1000, edgeLength: 70, layoutAnimation: true, }, symbolSize: 70, nodeScaleRatio: 1, //图标大小是否随鼠标滚动而变 roam: true, //缩放 draggable: true, //节点是否可以拖拽 focusNodeAdjacency: false, //是否在鼠标移到节点上的时候突出显示节点以及节点的边和邻接节点 edgeSymbol: ['circle', 'arrow'], //线2头标记 label: { normal: { show: true, position: 'inside', color: 'gold' } }, edgeLabel: { normal: { show: true, textStyle: { fontSize: 12, color: '#fff' }, formatter: "{c}" } }, categories: [{ name: '亲人', }, { name: '租户', symbol: 'rect' }], itemStyle: { normal: { borderColor: '#04f2a7', borderWidth: 2, shadowBlur: 10, shadowColor: '#04f2a7', color: '#001c43', } }, lineStyle: { normal: { opacity: 0.9, width: 2, curveness: 0, color: { type: 'linear', x: 0, y: 0, x2: 0, y2: 1, colorStops: [{ offset: 0, color: '#e0f55a' // 0% 处的颜色 }, { offset: 1, color: '#639564' // 100% 处的颜色 }], globalCoord: false // 缺省为 false } } }, symbolKeepAspect: false, data: [{ name: '李富贵', }, { name: '王桂花', }, { name: '李思思', }, { name: '自住房屋', }, { name: '车子', }, { name: '租房', }, { name: '黄涛', }, { name: '于海', }, { name: '张柏', }, { name: '付梦杰', } ], links: [{ source: 0, target: 1, value: '夫妻' }, { source: 0, target: 2, value: '父女' }, { source: 0, target: 3, value: '自住' }, { source: 0, target: 4, value: '车主' }, { source: 0, target: 5, value: '租户' }, { source: 5, target: 6, value: '租赁' }, { source: 5, target: 7, value: '租赁' }, { source: 5, target: 8, value: '租赁' }, { source: 5, target: 9, value: '租赁' } ], }]}chart_b859ef36a1b245b2b1eb24efe9b62146.setOption(option); </script></div></body></html>也可以是这样
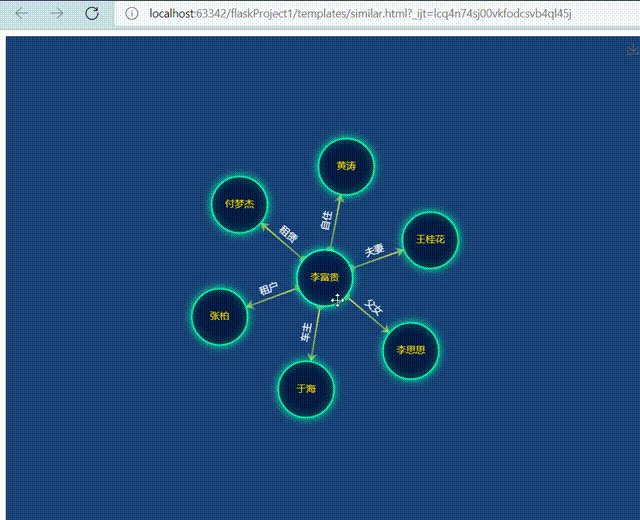
<html lang="en"><head> <meta charset="UTF-8"> <title>Title</title> <script src="https://assets.pyecharts.org/assets/echarts.min.js"></script></head><body><div id="garps" class="container" style="width: 800px;height: 600px"><script src="https://assets.pyecharts.org/assets/main.js"></script> <script> var chart_b859ef36a1b245b2b1eb24efe9b62146 = echarts.init( document.getElementById('garps'), 'white', {renderer: 'canvas'}); option = { backgroundColor: '#1a4377', grid: { left: '10%', top: 60, right: '10%', bottom: 60, }, toolbox: { feature: { saveAsImage: {} } }, series: [{ type: 'graph', layout: 'force', force: { repulsion: 1000, edgeLength: 70, layoutAnimation: true, }, symbolSize: 70, nodeScaleRatio: 1, //图标大小是否随鼠标滚动而变 roam: true, //缩放 draggable: true, //节点是否可以拖拽 focusNodeAdjacency: false, //是否在鼠标移到节点上的时候突出显示节点以及节点的边和邻接节点 edgeSymbol: ['circle', 'arrow'], //线2头标记 label: { normal: { show: true, position: 'inside', color: 'gold' } }, edgeLabel: { normal: { show: true, textStyle: { fontSize: 12, color: '#fff' }, formatter: "{c}" } }, categories: [{ name: '亲人', }, { name: '租户', symbol: 'rect' }], itemStyle: { normal: { borderColor: '#04f2a7', borderWidth: 2, shadowBlur: 10, shadowColor: '#04f2a7', color: '#001c43', } }, lineStyle: { normal: { opacity: 0.9, width: 2, curveness: 0, color: { type: 'linear', x: 0, y: 0, x2: 0, y2: 1, colorStops: [{ offset: 0, color: '#e0f55a' // 0% 处的颜色 }, { offset: 1, color: '#639564' // 100% 处的颜色 }], globalCoord: false // 缺省为 false } } }, symbolKeepAspect: false, data: [{ name: '李富贵', }, { name: '王桂花', }, { name: '李思思', }, { name: '黄涛', }, { name: '于海', }, { name: '张柏', }, { name: '付梦杰', } ], links: [{ source: 0, target: 1, value: '夫妻' }, { source: 0, target: 2, value: '父女' }, { source: 0, target: 3, value: '自住' }, { source: 0, target: 4, value: '车主' }, { source: 0, target: 5, value: '租户' }, { source: 0, target: 6, value: '租赁' } ], }]}chart_b859ef36a1b245b2b1eb24efe9b62146.setOption(option); </script></div></body></html>拿去就能跑,不会要导js等包,因为是动态的地址
<script src="https://assets.pyecharts.org/assets/main.js"></script>当需要这个js包的时候会自动去访问官网的这个js包,没有必要一定要把它下载到自己的电脑。
觉得有用的可以给个三连,关注一波!!!带你了解更多的前端小知识

