pyecharts实现疫情可视化地图学习笔记
参考
数据可视化pyecharts使用
python爬虫之全国疫情数据可视化
利用Python实现新冠疫情数据可视化
python爬虫:新冠疫情累计确诊数据爬取及数据可视化
用pyecharts画地图
效果

疫情可视化数据地图
实现疫情可视化地图python代码
from datetime import dateimport requestsfrom pyecharts import options as optsfrom pyecharts.charts import Mapfrom pyecharts.globals import ThemeTypeupdate_date = date.today()# 1.疫情接口url = "https://lab.isaaclin.cn/nCoV/api/area"# 2.向url发请求,并将获取到的数据转换成json格式resultJson = requests.get(url).json()# 3.定义一个列表存储最终结果province_data = []# 4.只取国内数据for item in resultJson['results']: if item['countryName'] == "中国": province_data.append( [ item['provinceShortName'], item['confirmedCount'] ] )c = ( Map(init_opts=opts.InitOpts(theme=ThemeType.DARK)) .add("全国确诊人数", province_data, "china", is_map_symbol_show=False) .set_global_opts( title_opts=opts.TitleOpts( title="新冠状病毒全国疫情地图", subtitle="更新日期:{}".format(update_date), ), # 视觉映射配置项 visualmap_opts=opts.VisualMapOpts( is_show=True, # 是否显示 min_=0, # 左下角刻度最小值 max_=2000 ) ) .render("全国疫情可视化.html"))生成HTML文件
<!DOCTYPE html><html><head> <meta charset="UTF-8"> <title>Awesome-pyecharts</title> <script type="text/javascript" src="https://assets.pyecharts.org/assets/echarts.min.js"></script> <script type="text/javascript" src="https://assets.pyecharts.org/assets/maps/china.js"></script></head><body> <div id="fe5046e1bcd04c87ba52713eceae039c" class="chart-container" style="width:900px; height:500px;"></div> <script> var chart_fe5046e1bcd04c87ba52713eceae039c = echarts.init( document.getElementById('fe5046e1bcd04c87ba52713eceae039c'), 'dark', {renderer: 'canvas'}); var option_fe5046e1bcd04c87ba52713eceae039c = { "animation": true, "animationThreshold": 2000, "animationDuration": 1000, "animationEasing": "cubicOut", "animationDelay": 0, "animationDurationUpdate": 300, "animationEasingUpdate": "cubicOut", "animationDelayUpdate": 0, "series": [ { "type": "map", "name": "\u5168\u56fd\u786e\u8bca\u4eba\u6570", "label": { "show": true, "position": "top", "margin": 8 }, "mapType": "china", "data": [ { "name": "\u5317\u4eac", "value": 2191 }, { "name": "\u4e2d\u56fd", "value": 699067 }, { "name": "\u53f0\u6e7e", "value": 150808 }, { "name": "\u9ed1\u9f99\u6c5f", "value": 2952 }, { "name": "\u4e0a\u6d77", "value": 59070 }, { "name": "\u9752\u6d77", "value": 95 }, { "name": "\u6d59\u6c5f", "value": 3111 }, { "name": "\u6c5f\u82cf", "value": 2206 }, { "name": "\u4e91\u5357", "value": 2119 }, { "name": "\u798f\u5efa", "value": 3022 }, { "name": "\u5185\u8499\u53e4", "value": 1751 }, { "name": "\u8fbd\u5b81", "value": 1646 }, { "name": "\u6c5f\u897f", "value": 1371 }, { "name": "\u6cb3\u5357", "value": 2907 }, { "name": "\u65b0\u7586", "value": 1007 }, { "name": "\u6e56\u5357", "value": 1385 }, { "name": "\u5c71\u4e1c", "value": 2722 }, { "name": "\u9999\u6e2f", "value": 330725 }, { "name": "\u5409\u6797", "value": 40242 }, { "name": "\u5929\u6d25", "value": 1804 }, { "name": "\u5e7f\u4e1c", "value": 7082 }, { "name": "\u9655\u897f", "value": 3277 }, { "name": "\u56db\u5ddd", "value": 2057 }, { "name": "\u6cb3\u5317", "value": 1998 }, { "name": "\u5b89\u5fbd", "value": 1065 }, { "name": "\u5e7f\u897f", "value": 1587 }, { "name": "\u5c71\u897f", "value": 418 }, { "name": "\u6d77\u5357", "value": 288 }, { "name": "\u91cd\u5e86", "value": 698 }, { "name": "\u6e56\u5317", "value": 68398 }, { "name": "\u8d35\u5dde", "value": 179 }, { "name": "\u7518\u8083", "value": 681 }, { "name": "\u6fb3\u95e8", "value": 82 }, { "name": "\u5b81\u590f", "value": 122 }, { "name": "\u897f\u85cf", "value": 1 } ], "roam": true, "aspectScale": 0.75, "nameProperty": "name", "selectedMode": false, "zoom": 1, "mapValueCalculation": "sum", "showLegendSymbol": false, "emphasis": {} } ], "legend": [ { "data": [ "\u5168\u56fd\u786e\u8bca\u4eba\u6570" ], "selected": { "\u5168\u56fd\u786e\u8bca\u4eba\u6570": true }, "show": true, "padding": 5, "itemGap": 10, "itemWidth": 25, "itemHeight": 14 } ], "tooltip": { "show": true, "trigger": "item", "triggerOn": "mousemove|click", "axisPointer": { "type": "line" }, "showContent": true, "alwaysShowContent": false, "showDelay": 0, "hideDelay": 100, "textStyle": { "fontSize": 14 }, "borderWidth": 0, "padding": 5 }, "title": [ { "text": "\u65b0\u51a0\u72b6\u75c5\u6bd2\u5168\u56fd\u75ab\u60c5\u5730\u56fe", "subtext": "\u66f4\u65b0\u65e5\u671f:2022-05-02", "padding": 5, "itemGap": 10 } ], "visualMap": { "show": true, "type": "continuous", "min": 0, "max": 2000, "inRange": { "color": [ "#50a3ba", "#eac763", "#d94e5d" ] }, "calculable": true, "inverse": false, "splitNumber": 5, "orient": "vertical", "showLabel": true, "itemWidth": 20, "itemHeight": 140, "borderWidth": 0 }}; chart_fe5046e1bcd04c87ba52713eceae039c.setOption(option_fe5046e1bcd04c87ba52713eceae039c); </script></body></html>世界地图
from pyecharts.charts import Map from pyecharts import options as optsimport randomcountry = ['China', 'Canada', 'France', 'Japan', 'Russia', 'USA']data_world = [(i, random.randint(100, 200)) for i in country]world = ( Map() .add('', # 此处没取名,所以空着 data_world, # 数据 'world') # 地图类型 .set_global_opts( title_opts=opts.TitleOpts(title='World Map'), visualmap_opts=opts.VisualMapOpts( max_=200, min_=100, is_piecewise=True) # 定义图例为分段型,默认为连续的图例 ) .set_series_opts(label_opts=opts.LabelOpts(is_show=False)) .render(path='世界地图.html'))[('China', 187), ('Canada', 111), ('France', 161), ('Japan', 199), ('Russia', 109), ('USA', 118)]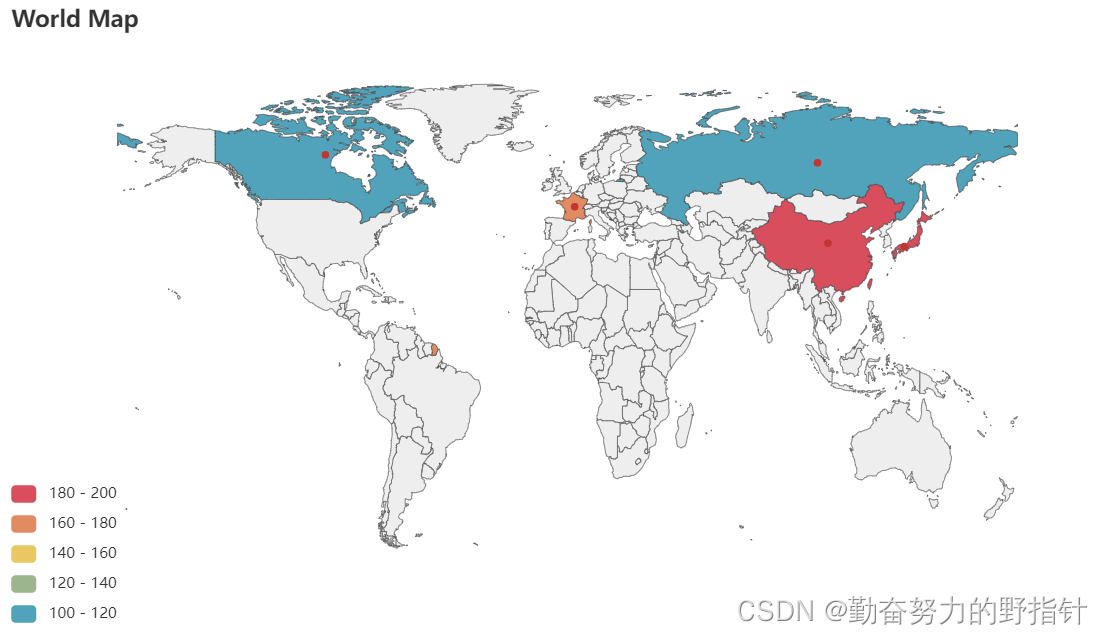
中国省级地图
from pyecharts.charts import Mapfrom pyecharts import options as optsimport randomprovince = ['广东', '湖北', '湖南', '四川', '重庆', '黑龙江', '浙江', '山西']data_province = [(i, random.randint(100, 200)) for i in province]print(data_province)china_province = ( Map() .add('', data_province, 'china') .set_global_opts( title_opts=opts.TitleOpts(title='Provinces of China'), visualmap_opts=opts.VisualMapOpts( min_=100, max_=200, is_piecewise=True) ) .render(path='中国省级地图.html'))[('广东', 167), ('湖北', 161), ('湖南', 140), ('四川', 130), ('重庆', 130), ('黑龙江', 158), ('浙江', 113), ('山西', 122)]
中国市级地图
from pyecharts.charts import Mapfrom pyecharts import options as optsimport randomcity = ['北京', '天津', '上海', '广州', '阿拉善盟', '株洲']data_city = [(i, random.randint(100, 200)) for i in city]print(data_city)china_city = ( Map() .add( "", data_city, "china-cities", label_opts=opts.LabelOpts(is_show=False), ) .set_global_opts( title_opts=opts.TitleOpts(title="中国市级地图"), visualmap_opts=opts.VisualMapOpts( min_=100, max_=200, is_piecewise=True ), ) .render("中国地级市地图.html"))[('北京', 169), ('天津', 170), ('上海', 183), ('广州', 109), ('阿拉善盟', 124), ('株洲', 199)]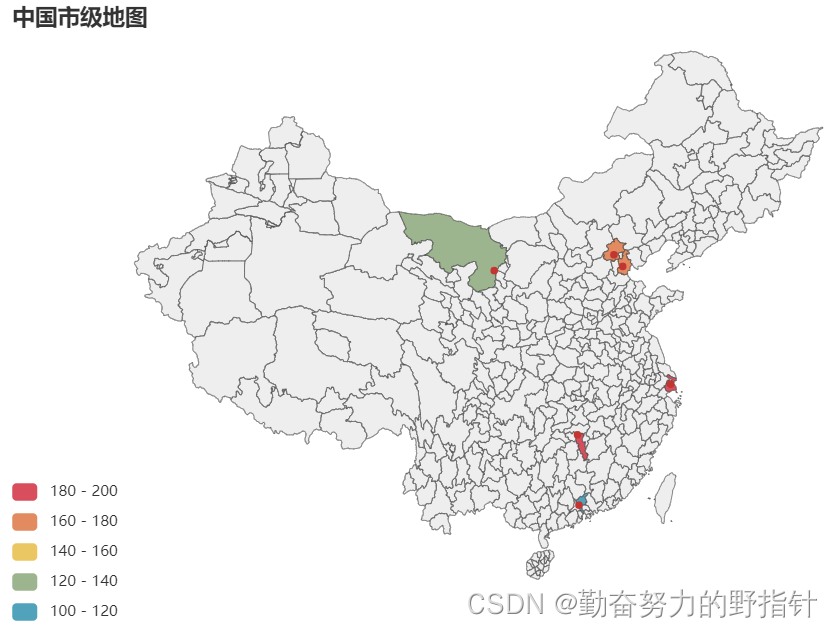
某省市级地图
from pyecharts.charts import Mapfrom pyecharts import options as optsimport randomprov_city = ['长沙市', '株洲市', '湘潭市', '衡阳市']data_prov_city = [(i, random.randint(100, 200)) for i in prov_city]print(data_prov_city)province_city = ( Map() .add("", data_prov_city, "湖南") .set_global_opts( title_opts=opts.TitleOpts(title="某省地级市地图"), visualmap_opts=opts.VisualMapOpts( min_=100, max_=200, is_piecewise=True ) ) .render(path="某省地级市地图.html"))[('长沙市', 107), ('株洲市', 113), ('湘潭市', 125), ('衡阳市', 115)]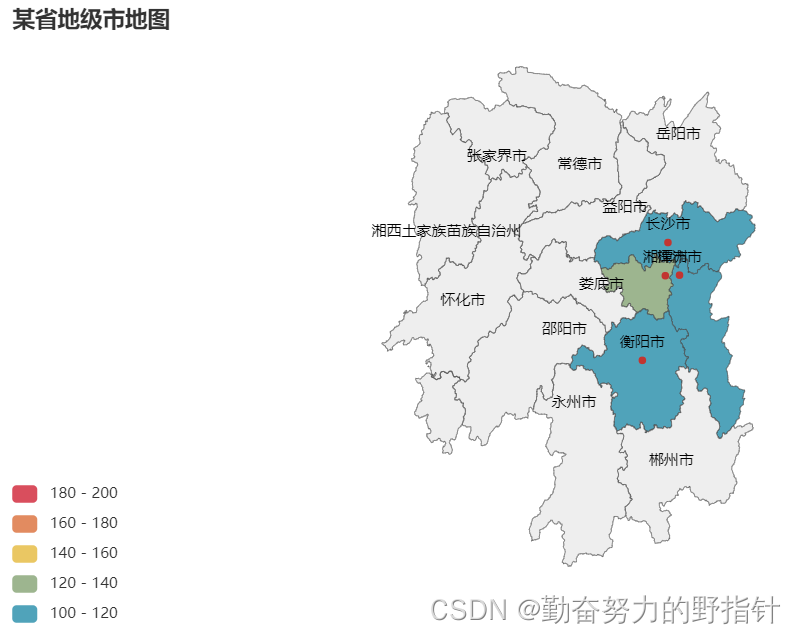
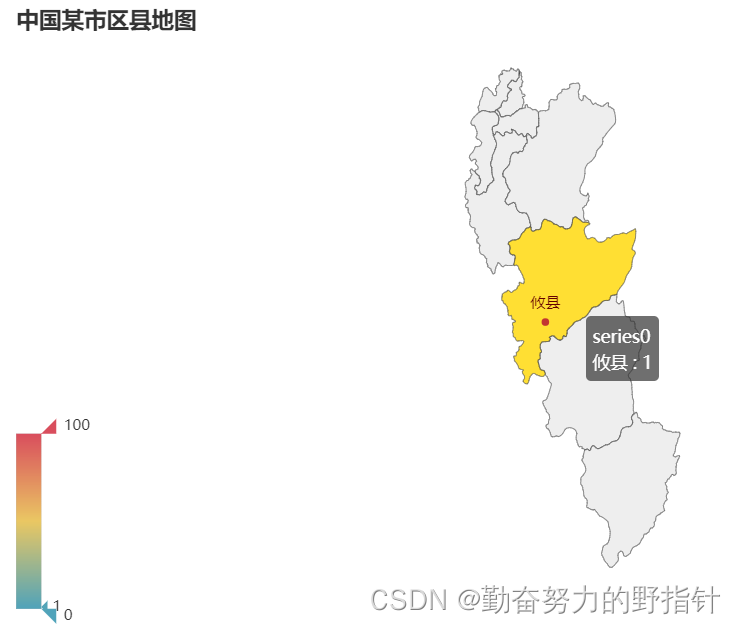
某市县级地图
from pyecharts.charts import Mapfrom pyecharts import options as optscounties = ( Map() .add( "", [['攸县', 1]], "株洲", label_opts=opts.LabelOpts(is_show=False) ) .set_global_opts( title_opts=opts.TitleOpts(title="中国某市区县地图"), visualmap_opts=opts.VisualMapOpts(), ) .render("某市的区县地图.html"))