计算机视觉/python环境下/机器学习之k近邻方法(KNN)实现对数据集的识别
机器学习
-
- 一、问题描述
- 二、效果图
- 三、代码附录
-
- KNN算法
- 模板匹配算法
- 模板匹配算法二
- 四、数据集附录
一、问题描述
采用KNN,模板匹配两种方法进行机器学习,切分训练集和测试集,从而实现对数据集的识别。
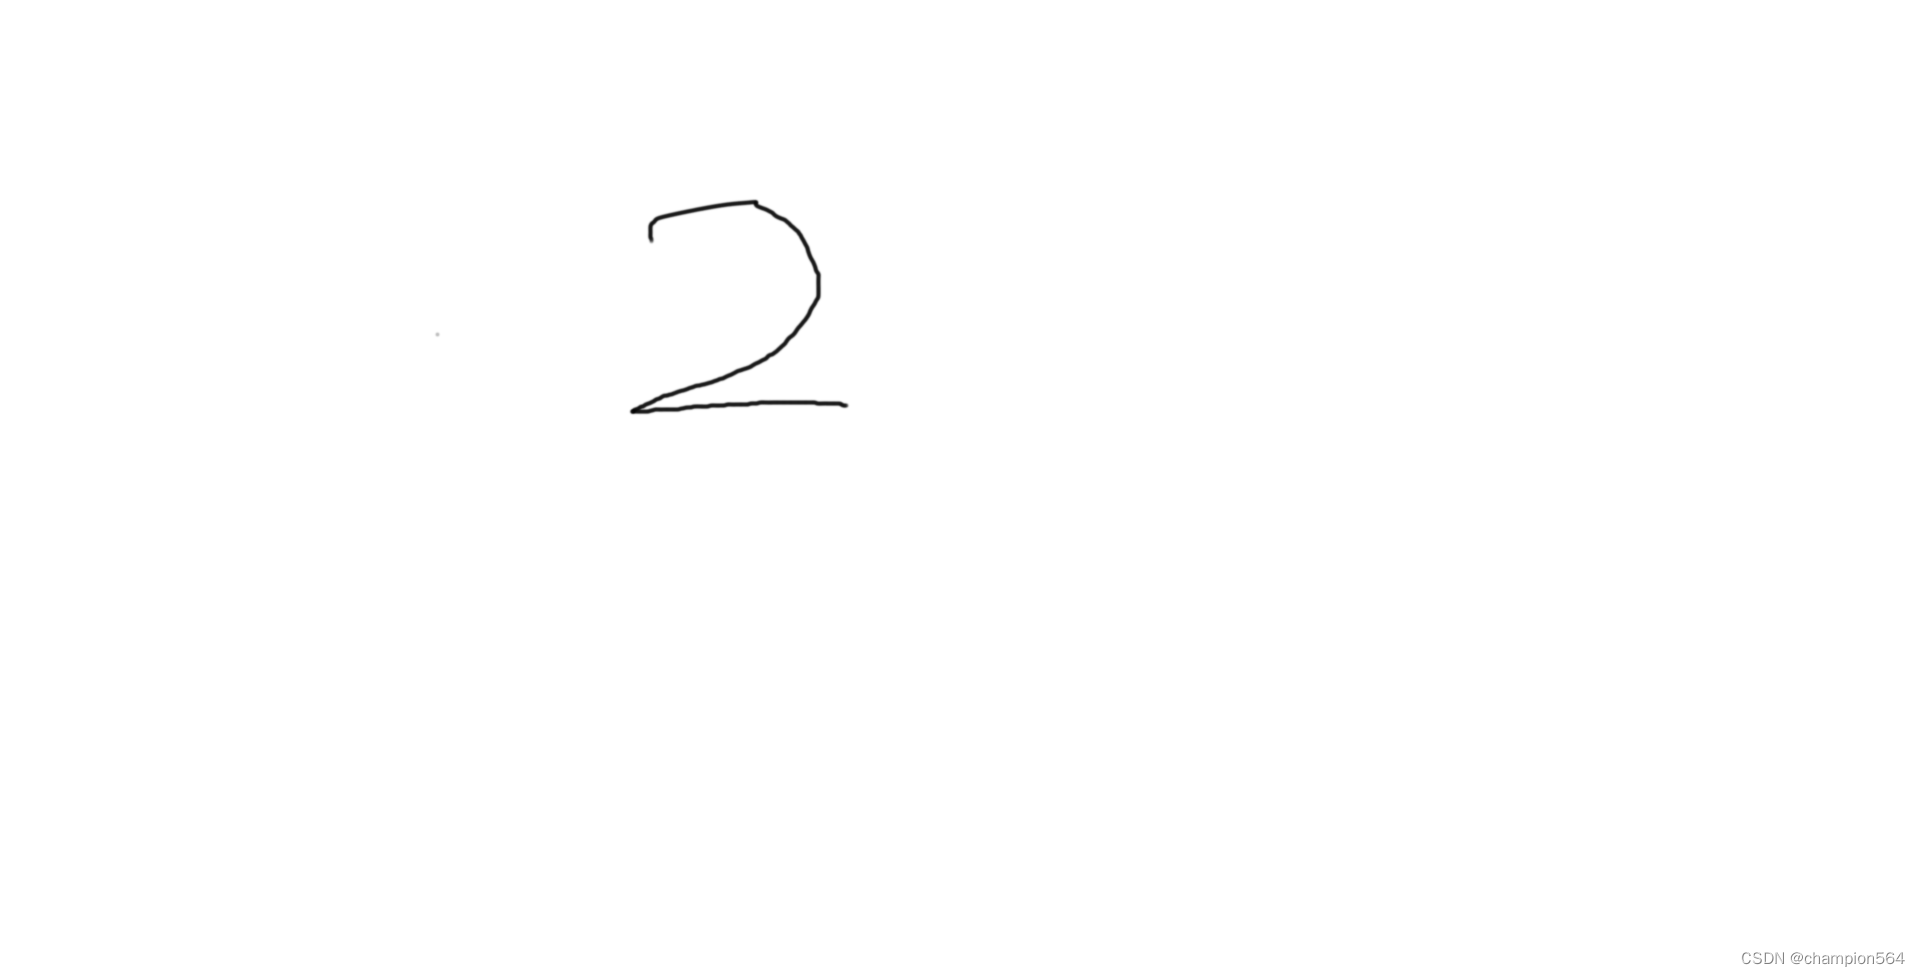
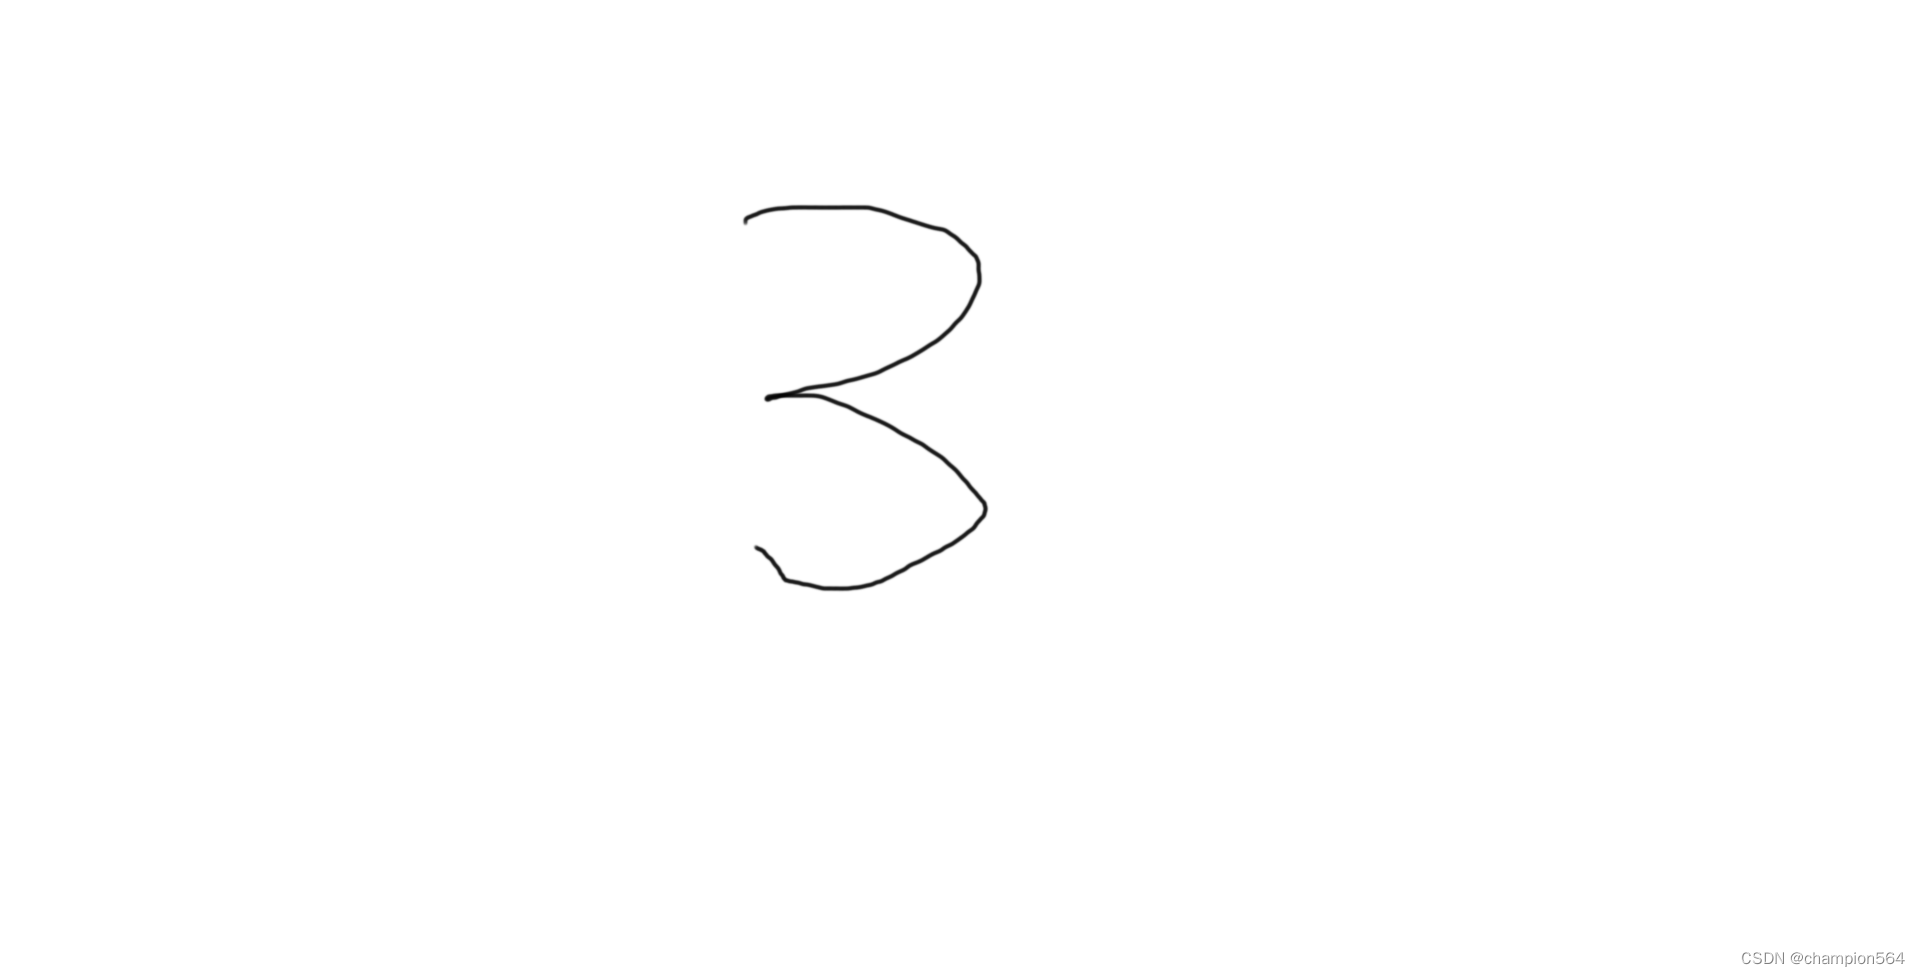
这里的例子采用的数据集是200张图片,包括手写的不同的0-9图片各20张,以此观察KNN算法和模板匹配算法下对于图片的识别的准确度差别。
二、效果图

三、代码附录
KNN算法
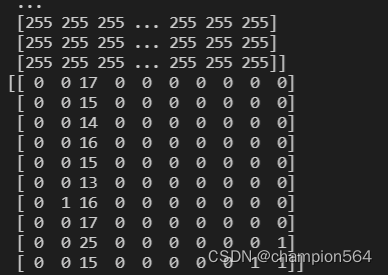
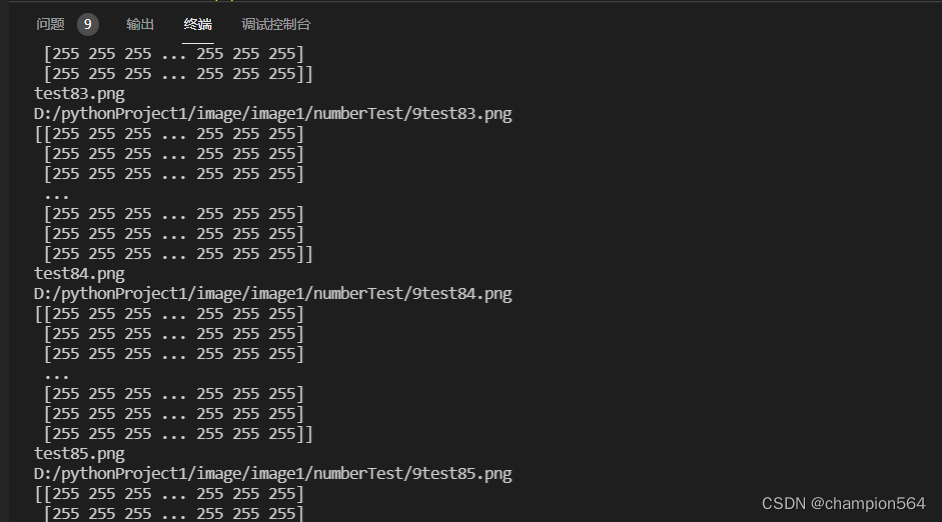
import numpy as npimport osimport cv2from sklearn.model_selection import train_test_splitfrom sklearn.metrics import confusion_matrix, classification_reportX = []Y = []for i in range(0, 10): # 遍历文件夹,读取图片 for f in os.listdir("D:/pythonProject1/image/image1/numberTest/%s" %i): # 打开一张图片并灰度化 print(f) Images = cv2.imread("D:/pythonProject1/image/image1/numberTest/%s/%s " % (i, f),0) print(("D:/pythonProject1/image/image1/numberTest/%s%s" % (i, f))) image = cv2.resize(Images, (256, 256),interpolation=cv2.INTER_CUBIC) print(image) hist = cv2.calcHist(image, [0, 1], None,[256, 256], [0.0, 255.0, 0.0, 255.0]) X.append(((hist / 255).flatten())) Y.append(i)X = np.array(X)Y = np.array(Y)# 切分训练集和测试集X_train, X_test, y_train, y_test = train_test_split(X, Y, test_size=0.2, random_state=1)# 随机率为100%(保证唯一性)选取其中的20%作为测试集class KNN: def __init__(self, train_data, train_label, test_data): self.train_data = train_data self.train_label = train_label self.test_data = test_data def classify(self): num_train = (self.train_data).shape[0] num_test = (self.test_data).shape[0] labels = [] for i in range(num_test): y = [] for j in range(num_train): dis = np.sum(np.square((self.train_data)[j] - (self.test_data)[i])) y.append(dis) labels.append(self.train_label[y.index(min(y))]) labels = np.array(labels) return labelsknn = KNN(X_train, y_train, X_test)predictions_labels = knn.classify()print(confusion_matrix(y_test, predictions_labels))print(classification_report(y_test, predictions_labels))模板匹配算法
import numpy as npimport osimport cv2from matplotlib import pyplot as pltfrom sklearn.model_selection import train_test_splitfrom sklearn.metrics import confusion_matrix, classification_reportX = []Y = []for i in range(0, 10): # 遍历文件夹,读取图片 for f in os.listdir("D:/pythonProject1/image/image1/numberTest/%s" %i): # 打开一张图片并灰度化 print(f) Images = cv2.imread("D:/pythonProject1/image/image1/numberTest/%s/%s " % (i, f),0) print(("D:/pythonProject1/image/image1/numberTest/%s%s" % (i, f))) image = cv2.cvtColor(Images,cv2.COLOR_BGR2GRAY) print(image) hist = cv2.calcHist(image, [0, 1], None,[256, 256], [0.0, 255.0, 0.0, 255.0]) X.append(((hist / 255).flatten())) Y.append(i)X = np.array(X)Y = np.array(Y)# 切分训练集和测试集X_train, X_test, y_train, y_test = train_test_split(X, Y, test_size=0.2, random_state=1)class moran: def __init__(self, train_data, train_label, test_data): self.train_data = train_data self.train_label = train_label self.test_data = test_data def classify(self): num_train = (self.train_data).shape[0] num_test = (self.test_data).shape[0] labels = [] for i in range(num_test): y = [] for j in range(num_train): res = cv2.matchTemplate(image, num_test, cv2.TM_CCOEFF_NORMED) threshold = 0.65 loc = np.where(res >= threshold) for pt in zip(*loc[::-1]): y.append(res) labels.append(self.train_label[y.index(min(y))]) labels = np.array(labels) return labelsmoran = moran(X_train, y_train, X_test)predictions_labels = moran.classify()print(confusion_matrix(y_test, predictions_labels))print(classification_report(y_test, predictions_labels))模板匹配算法二
import cv2import numpy as npfrom matplotlib import pyplot as pltimg_rgb = cv2.imread('')img_gray = cv2.cvtColor(img_rgb, cv2.COLOR_BGR2GRAY)template1 = cv2.imread('roi4_1.png', 0) #相当于测试集template2 = cv2.imread('roi4_2.png', 0)template3 = cv2.imread('roi4_3.png', 0)template_list = ['roi4_1.png', 'roi4_2.png', 'roi4_3.png']w1, h1 = template1.shape[::-1] #测试集的数据w2, h2 = template1.shape[::-1]w3, h3 = template1.shape[::-1]plt.subplot(131)plt.imshow(template1)plt.subplot(132)plt.imshow(template2)plt.subplot(133)plt.imshow(template3)plt.show()for i in range(len(template_list)): template = cv2.imread(template_list[i], 0) w, h = template.shape[::-1] res = cv2.matchTemplate(img_gray, template, cv2.TM_CCOEFF_NORMED) threshold = 0.65 loc = np.where(res >= threshold) for pt in zip(*loc[::-1]): gray = int(255/(i+1)) cv2.rectangle(img_rgb, pt, (pt[0] + w, pt[1] + h), (gray, gray, gray), 2)plt.imshow(img_rgb)plt.show()四、数据集附录
手绘数据集展示如下:


 开发者涨薪指南
  48位大咖的思考法则、工作方式、逻辑体系

