3D飞线地球
随着前端技术的飞速发展与日渐成熟,web3d应用已渗透到生活的方方面面,与传统的web应用相比,3D应用在页面的展示效果、可操作性上亦或是视觉体验上都有着不可比拟的优点。对于前端开发者来说,在网页上实现一个3D应用,需要掌握的技术不胜枚举,如图形学、web-gl基础知识、Threejs等。好在echarts官方基于web-gl技术,提供了echarts-gl开源js库,大大简化了web3d图表的开发方式,本文基于echarts和echarts-gl实现一个3D飞线地球,简单讲解一下具体的实现方法。
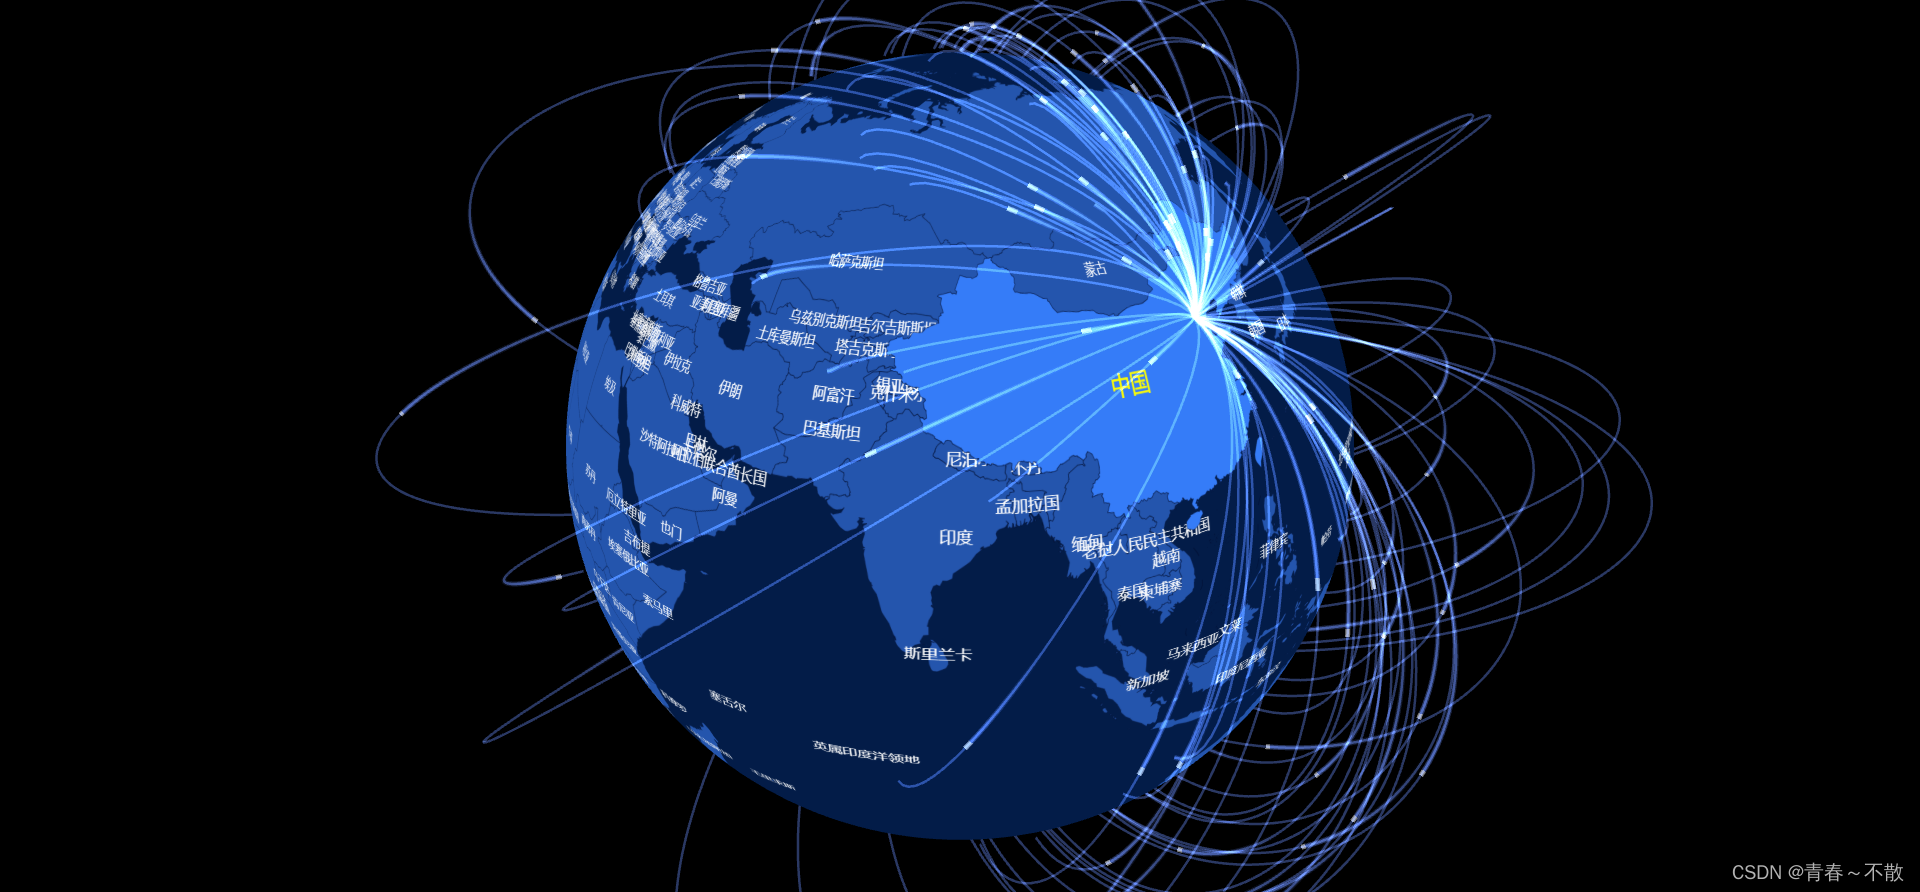
实现效果如下:
页面布局如下:
备注:这里有一个注意事项,echarts与echarts-gl的版本务必保持一致,这里分别采用了5.1.2和2.0.5的版本
样式如下:
* { margin: 0; padding: 0;}html,body { height: 100%; width: 100%;}具体实现逻辑:
var dom = document.getElementById("earth")var myChart = echarts.init(dom);var baseTexture = nullvar option = nullvar geoJson = null// 加载世界地图function getGeoJsonData() { var xhr = new XMLHttpRequest(); xhr.open('GET', './js/world.json', false); xhr.onreadystatechange = function () { if (xhr.readyState == 4) { if (xhr.status == 200 || xhr.status == 304) { geoJson = JSON.parse(xhr.responseText) getBaseTexture() } } } xhr.send();}// 使用echarts生成贴图,用于创建球体表面纹理function getBaseTexture() { echarts.registerMap("world", geoJson); let canvas = document.createElement("canvas"); baseTexture = echarts.init(canvas, null, { width: 4096, height: 2048 }); baseTexture.setOption({ backgroundColor: "rgb(3,28,72)", geo: { type: "map", map: "world", left: 0, top: 0, right: 0, bottom: 0, boundingCoords: [ [-180, 90], [180, -90], ], zoom: 0, roam: false, itemStyle: { borderColor: "#000d2d", normal: { areaColor: "#2455ad", borderColor: "#000c2d", }, emphasis: { areaColor: "#357cf8", }, }, label: { normal: { fontSize: 20, show: true, textStyle: { color: "#fff", }, }, emphasis: { fontSize: 30, show: true, textStyle: { color: "yellow", }, }, }, }, }); drawEarth()}// 绘制球体function drawEarth() { option = { backgroundColor: "#013954", tooltip: { trigger: "item", }, globe: { baseTexture: baseTexture, globeRadius: 150, environment: "#000", //shading: "lambert", shading: "color", light: { // 光照阴影 main: { color: "#fff", // 光照颜色 intensity: 1, // 光照强度 //shadowQuality: "high", //阴影亮度 //shadow: true, // 是否显示阴影 alpha: 40, beta: -30, }, ambient: { color: "#fff", intensity: 1, }, }, viewControl: { alpha: 30, beta: 160, // targetCoord: [116.46, 39.92], autoRotate: true, autoRotateAfterStill: 10, distance: 240, }, }, series: [ { name: "lines3D", type: "lines3D", coordinateSystem: "globe", effect: { show: true, }, blendMode: "lighter", lineStyle: { width: 2, }, data: [], silent: false, }, ], }; // 随机数据 i控制线数量 for (let i = 0; i < 100; i++) { option.series[0].data = option.series[0].data.concat(randomData()); } myChart.setOption(option, true);}// 随机生成起始及终点经纬度坐标function randomData() { let name = "随机点" + Math.random().toFixed(5) * 100000; // 起点经纬度-北京 let longitude = 116.2, latitude = 39.56; // 随机终点经纬度 let longitude2 = Math.random() * 360 - 180; let latitude2 = Math.random() * 180 - 90; return { coords: [ [longitude, latitude], [longitude2, latitude2], ], value: (Math.random() * 3000).toFixed(2), };}// 初始化入口getGeoJsonData()是不是非常简单,短短的150行代码即可实现一个3D图表,如果小伙伴们有其它的实现方式,可以在评论区里面探讨一下😊
 开发者涨薪指南
  48位大咖的思考法则、工作方式、逻辑体系

