决策树算法-人工智能
一、运行环境
操作系统: Windows10
开发软件: Anaconda3
Python 版本: Python 3 及以上
所需要的依赖包:无
二、操作步骤
在命令行或 Anaconda3 等集成开发环境中运行程序 trees.py。
- 结果展示
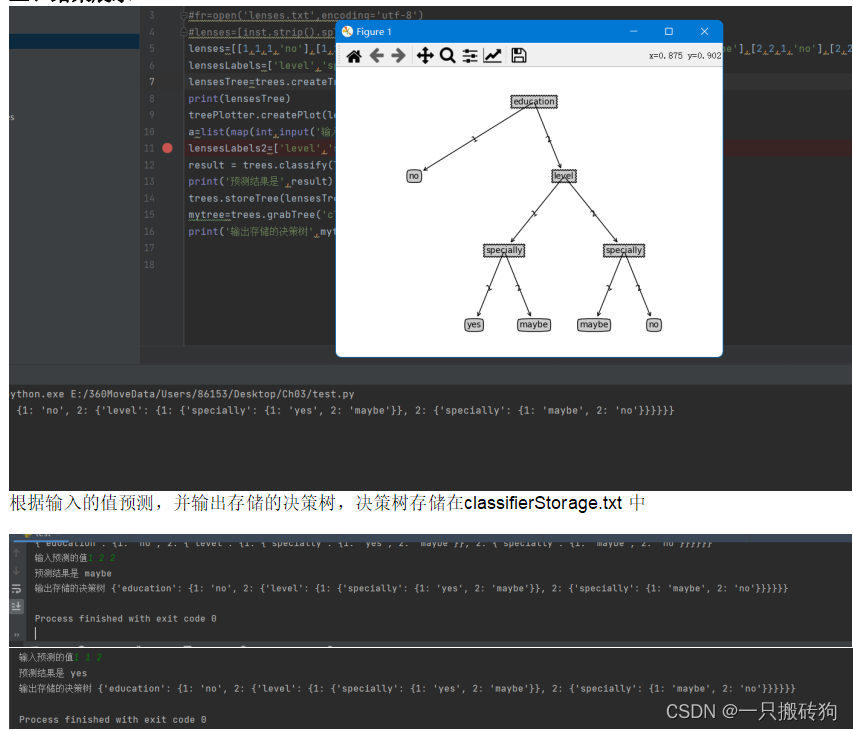
test.py
import treesimport treePlotter#fr=open('lenses.txt',encoding='utf-8')#lenses=[inst.strip().split('\t') for inst in fr.readlines()]lenses=[[1,1,1,'no'],[1,1,2,'yes'],[1,2,1,'no'],[1,2,2,'maybe'],[2,1,1,'no'],[2,1,2,'maybe'],[2,2,1,'no'],[2,2,2,'no']]lensesLabels=['level','specially','education']lensesTree=trees.createTree(lenses,lensesLabels)print(lensesTree)treePlotter.createPlot(lensesTree)a=list(map(int,input('输入预测的值').split(' ')))lensesLabels2=['level','specially','education']result = trees.classify(lensesTree, lensesLabels2, a)print('预测结果是',result)trees.storeTree(lensesTree,'classifierStorage.txt')mytree=trees.grabTree('classifierStorage.txt')print('输出存储的决策树',mytree)treePlotter.py
'''Created on Oct 14, 2010@author: Peter Harrington'''import matplotlib.pyplot as pltdecisionNode = dict(boxstyle="sawtooth", fc="0.8")leafNode = dict(boxstyle="round4", fc="0.8")arrow_args = dict(arrowstyle=" maxDepth: maxDepth = thisDepth return maxDepthdef plotNode(nodeTxt, centerPt, parentPt, nodeType): createPlot.ax1.annotate(nodeTxt, xy=parentPt, xycoords='axes fraction', xytext=centerPt, textcoords='axes fraction', va="center", ha="center", bbox=nodeType, arrowprops=arrow_args ) def plotMidText(cntrPt, parentPt, txtString): xMid = (parentPt[0]-cntrPt[0])/2.0 + cntrPt[0] yMid = (parentPt[1]-cntrPt[1])/2.0 + cntrPt[1] createPlot.ax1.text(xMid, yMid, txtString, va="center", ha="center", rotation=30)def plotTree(myTree, parentPt, nodeTxt):#if the first key tells you what feat was split on numLeafs = getNumLeafs(myTree) #this determines the x width of this tree depth = getTreeDepth(myTree) firstStr = list(myTree.keys())[0] #the text label for this node should be this cntrPt = (plotTree.xOff + (1.0 + float(numLeafs))/2.0/plotTree.totalW, plotTree.yOff) plotMidText(cntrPt, parentPt, nodeTxt) plotNode(firstStr, cntrPt, parentPt, decisionNode) secondDict = myTree[firstStr] plotTree.yOff = plotTree.yOff - 1.0/plotTree.totalD for key in secondDict.keys(): if type(secondDict[key]).__name__=='dict':#test to see if the nodes are dictonaires, if not they are leaf nodes plotTree(secondDict[key],cntrPt,str(key)) #recursion else: #it's a leaf node print the leaf node plotTree.xOff = plotTree.xOff + 1.0/plotTree.totalW plotNode(secondDict[key], (plotTree.xOff, plotTree.yOff), cntrPt, leafNode) plotMidText((plotTree.xOff, plotTree.yOff), cntrPt, str(key)) plotTree.yOff = plotTree.yOff + 1.0/plotTree.totalD#if you do get a dictonary you know it's a tree, and the first element will be another dictdef createPlot(inTree): fig = plt.figure(1, facecolor='white') fig.clf() axprops = dict(xticks=[], yticks=[]) createPlot.ax1 = plt.subplot(111, frameon=False, axprops) #no ticks #createPlot.ax1 = plt.subplot(111, frameon=False) #ticks for demo puropses plotTree.totalW = float(getNumLeafs(inTree)) plotTree.totalD = float(getTreeDepth(inTree)) plotTree.xOff = -0.5/plotTree.totalW; plotTree.yOff = 1.0; plotTree(inTree, (0.5,1.0), '') plt.show()#def createPlot():# fig = plt.figure(1, facecolor='white')# fig.clf()# createPlot.ax1 = plt.subplot(111, frameon=False) #ticks for demo puropses # plotNode('a decision node', (0.5, 0.1), (0.1, 0.5), decisionNode)# plotNode('a leaf node', (0.8, 0.1), (0.3, 0.8), leafNode)# plt.show()def retrieveTree(i): listOfTrees =[{'no surfacing': {0: 'no', 1: {'flippers': {0: 'no', 1: 'yes'}}}}, {'no surfacing': {0: 'no', 1: {'flippers': {0: {'head': {0: 'no', 1: 'yes'}}, 1: 'no'}}}} ] return listOfTrees[i]#createPlot(thisTree)trees.py
'''Created on Oct 12, 2010Decision Tree Source Code for Machine Learning in Action Ch. 3@author: Peter Harrington'''from math import logimport operatordef createDataSet(): dataSet = [[1, 1, 'yes'], [1, 1, 'yes'], [1, 0, 'no'], [0, 1, 'no'], [0, 1, 'no']] labels = ['no surfacing','flippers'] #change to discrete values return dataSet, labelsdef calcShannonEnt(dataSet): numEntries = len(dataSet) labelCounts = {} for featVec in dataSet: #the the number of unique elements and their occurance currentLabel = featVec[-1] if currentLabel not in labelCounts.keys(): labelCounts[currentLabel] = 0 labelCounts[currentLabel] += 1 shannonEnt = 0.0 for key in labelCounts: prob = float(labelCounts[key])/numEntries shannonEnt -= prob * log(prob,2) #log base 2 return shannonEnt def splitDataSet(dataSet, axis, value): retDataSet = [] for featVec in dataSet: if featVec[axis] == value: reducedFeatVec = featVec[:axis] #chop out axis used for splitting reducedFeatVec.extend(featVec[axis+1:]) retDataSet.append(reducedFeatVec) return retDataSet def chooseBestFeatureToSplit(dataSet): numFeatures = len(dataSet[0]) - 1 #the last column is used for the labels baseEntropy = calcShannonEnt(dataSet) bestInfoGain = 0.0; bestFeature = -1 for i in range(numFeatures): #iterate over all the features featList = [example[i] for example in dataSet]#create a list of all the examples of this feature uniqueVals = set(featList)#get a set of unique values newEntropy = 0.0 for value in uniqueVals: subDataSet = splitDataSet(dataSet, i, value) prob = len(subDataSet)/float(len(dataSet)) newEntropy += prob * calcShannonEnt(subDataSet) infoGain = baseEntropy - newEntropy #calculate the info gain; ie reduction in entropy if (infoGain > bestInfoGain):#compare this to the best gain so far bestInfoGain = infoGain #if better than current best, set to best bestFeature = i return bestFeature #returns an integerdef majorityCnt(classList): classCount={} for vote in classList: if vote not in classCount.keys(): classCount[vote] = 0 classCount[vote] += 1 sortedClassCount = sorted(classCount.iteritems(), key=operator.itemgetter(1), reverse=True) return sortedClassCount[0][0]def createTree(dataSet,labels): classList = [example[-1] for example in dataSet] if classList.count(classList[0]) == len(classList): return classList[0]#stop splitting when all of the classes are equal if len(dataSet[0]) == 1: #stop splitting when there are no more features in dataSet return majorityCnt(classList) bestFeat = chooseBestFeatureToSplit(dataSet) bestFeatLabel = labels[bestFeat] myTree = {bestFeatLabel:{}} del(labels[bestFeat]) featValues = [example[bestFeat] for example in dataSet] uniqueVals = set(featValues) for value in uniqueVals: subLabels = labels[:]#copy all of labels, so trees don't mess up existing labels myTree[bestFeatLabel][value] = createTree(splitDataSet(dataSet, bestFeat, value),subLabels) return myTree def classify(inputTree,featLabels,testVec): firstStr = list(inputTree.keys())[0] secondDict = inputTree[firstStr] featIndex = featLabels.index(firstStr) key = testVec[featIndex] valueOfFeat = secondDict[key] if isinstance(valueOfFeat, dict): classLabel = classify(valueOfFeat, featLabels, testVec) else: classLabel = valueOfFeat return classLabeldef storeTree(inputTree,filename): import pickle fw = open(filename,'wb+') pickle.dump(inputTree,fw) fw.close() def grabTree(filename): import pickle fr = open(filename,'rb') return pickle.load(fr)

