【收藏】如何优雅的在 Python matplotlib 中可视化矩阵,以及cmap色带设置
有时需要将numpy矩阵绘制出来看趋势,这时候可以使用plt.imshow() 方法来可视化
同时还需要对cmap进行设置,使用不同的色带,达到更好的可视化效果。
代码
import numpy as npfrom matplotlib import pyplot as pltdata2D = np.random.random((50, 50))im = plt.imshow(data2D, cmap="RdPu") # 绘制并设置色带plt.colorbar(im) # 添加图例plt.show()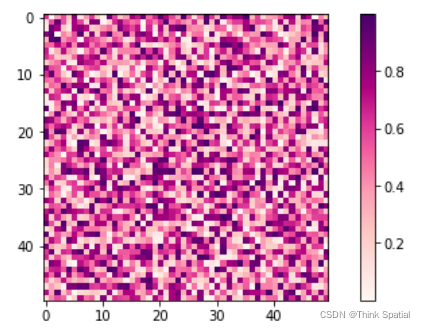
不同cmap参数可视化情况
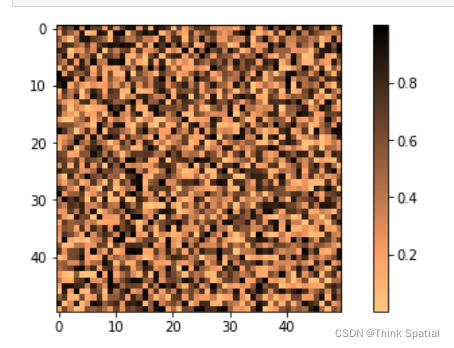
cmap=“copper_r”
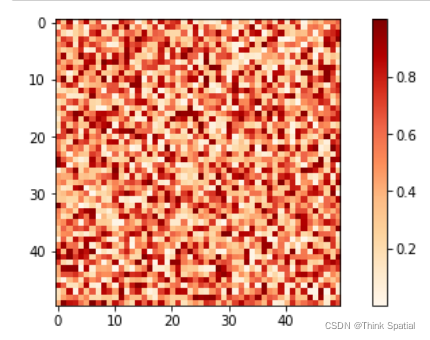
cmap=“OrRd”
可供选择的颜色色带cmap
参考这篇文章
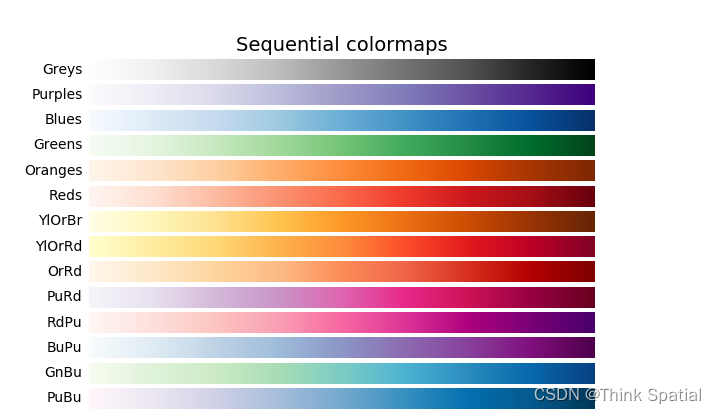
Sequential Colormaps
cmaps['Perceptually Uniform Sequential'] = [ 'viridis', 'plasma', 'inferno', 'magma', 'cividis'] cmaps['Sequential'] = [ 'Greys', 'Purples', 'Blues', 'Greens', 'Oranges', 'Reds', 'YlOrBr', 'YlOrRd', 'OrRd', 'PuRd', 'RdPu', 'BuPu', 'GnBu', 'PuBu']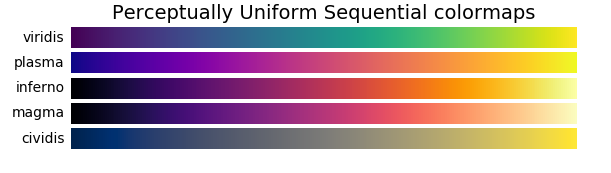
Diverging Matplotlib cmap()
cmaps['Diverging'] = [ 'PiYG', 'PRGn', 'BrBG', 'PuOr', 'RdGy', 'RdBu', 'RdYlBu', 'RdYlGn', 'Spectral']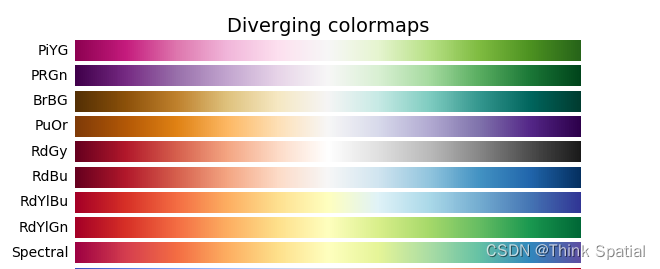
Cyclic Matplotlib cmap()
cmaps['Cyclic'] = ['twilight', 'twilight_shifted', 'hsv']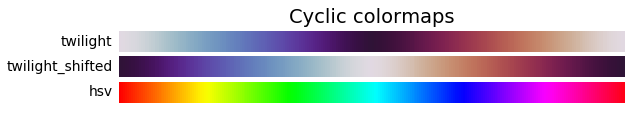
Qualitatve Matplotlib cmap()
cmaps['Qualitative'] = ['Pastel1', 'Pastel2', 'Paired', 'Accent', 'Dark2', 'Set1', 'Set2', 'Set3']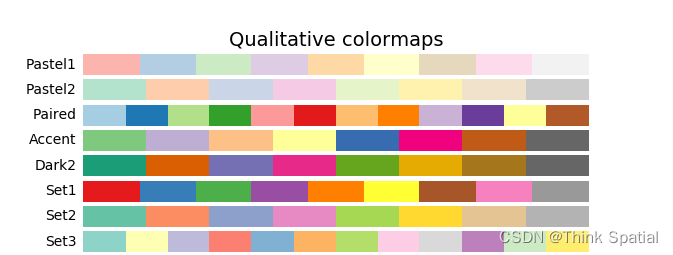
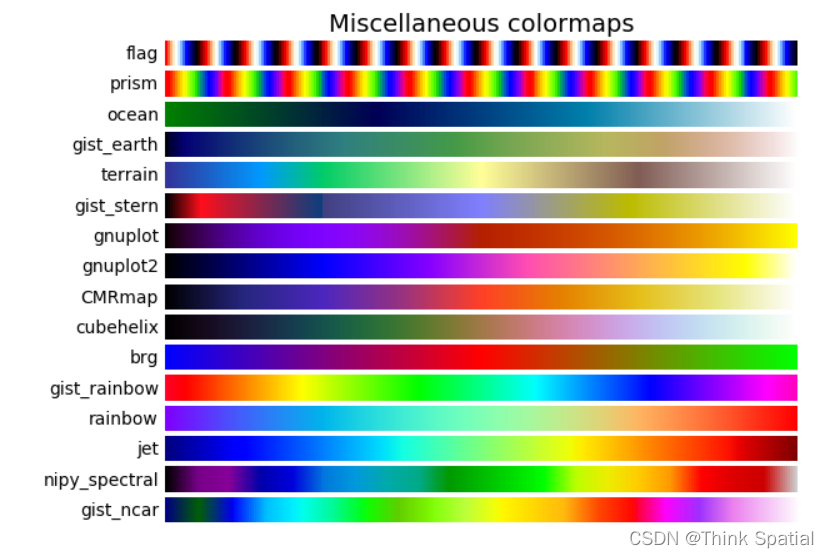
Miscellaneous Matplotlib cmap()
cmaps['Qualitative'] = ['flag', 'prism', 'ocean', 'gist_earth', 'terrain', 'gist_stern', 'gnuplot', 'gnuplot2', 'CMRmap', 'cubehelix', 'brg', 'gist_rainbow', 'rainbow', 'jet', 'nipy_spectral', 'gist_ncar']