k8s之pushgateway-v1.4.2部署
PushGateway简介
- Pushgateway 是 prometheus 的一个组件,
prometheus server默认是通过exporter主动获取数据(默认采取 pull 拉取数据)pushgateway 则是通过被动方式推送数据到 prometheus server,用户可以写一些自定义的监控脚本把需要监控的数据发送给 pushgateway然后pushgateway 再把数据发送给 Prometheus server - Prometheus默认采用定时 pull 模式拉取 targets 数据,但是如果不在一个子网或者防火墙,prometheus就拉取不到 targets 数据,所以可以采用各个 target 往 pushgateway 上 push 数据,然后 prometheus 去 pushgateway 上定时 pull 数据
- 在监控业务数据的时候,需要将不同数据汇总,
汇总之后的数据可以由 pushgateway 统一收集,然后由 Prometheus 统一拉取 - Prometheus拉取状态只针对 pushgateway, 不能对每个节点都有效;
Pushg ateway 出现问题,整个采集到的数据都会出现问题,监控下线,prometheus 还会拉取到旧的监控数据,需要手动清理 pushgateway 不要的数据
Github链接:https://github.com/prometheus/pushgateway
PushGateway-v1.4.2部署
| 主机 | IP |
|---|---|
k8s-master-1(Prometheus-server) |
192.168.0.10 |
k8s-node-1(Push-Gateway) |
192.168.0.11 |
Prometheus-Server
[root@k8s-master-1 pushgateway]# cat prometheus-server.yaml apiVersion: rbac.authorization.k8s.io/v1kind: ClusterRolemetadata: name: prometheusrules:- apiGroups: [""] resources: ["nodes","nodes/proxy","services","endpoints","pods"] verbs: ["get", "list", "watch"]- apiGroups: ["extensions"] resources: ["ingresses"] verbs: ["get", "list", "watch"]- nonResourceURLs: ["/metrics"] verbs: ["get"]---apiVersion: v1kind: ServiceAccountmetadata: name: prometheus namespace: kube-prometheus---apiVersion: rbac.authorization.k8s.io/v1kind: ClusterRoleBindingmetadata: name: prometheusroleRef: apiGroup: rbac.authorization.k8s.io kind: ClusterRole name: prometheussubjects:- kind: ServiceAccount name: prometheus namespace: kube-prometheus---apiVersion: v1kind: ConfigMapmetadata: name: prometheus-config namespace: kube-prometheusdata: prometheus.yml: |- global: scrape_interval: 15sscrape_timeout: 10s evaluation_interval: 1m scrape_configs: - job_name: 'PushGateway' honor_labels: true # 必须要加一个参数honor_labels: true,如果不加,会造成推送给Pushgateway的instance和job全部加了"exported_"前缀 static_configs: - targets: ['192.168.0.11:9091'] # Work节点 labels: instance: 'PushGateway'---apiVersion: v1kind: Servicemetadata: name: prometheus namespace: kube-prometheus labels: name: prometheus-serverspec: ports: - name: prometheus protocol: TCP port: 9090 targetPort: 9090 nodePort: 40000# 将其在宿主机暴露端口固定成40000 selector: name: prometheus-server type: NodePort---apiVersion: apps/v1kind: Deploymentmetadata: name: prometheus-server namespace: kube-prometheus labels: name: prometheus-serverspec: selector: matchLabels: name: prometheus-server template: metadata: labels: name: prometheus-server spec: nodeName: k8s-master-1 # 指定在Master节点运行 serviceAccountName: prometheus containers: - name: prometheus image: prom/prometheus:v2.35.0 imagePullPolicy: IfNotPresent command: - prometheus - --config.file=/etc/prometheus/prometheus.yml - --storage.tsdb.path=/prometheus# 旧数据存储目录 - --storage.tsdb.retention=720h # 何时删除旧数据,默认为15天。 - --web.enable-lifecycle # 开启热加载 ports: - containerPort: 9090 protocol: TCP volumeMounts: - name: prometheus-storage-volume mountPath: /prometheus/ - name: prometheus-config mountPath: /etc/prometheus/prometheus.yml subPath: prometheus.yml readinessProbe: httpGet: path: /-/ready port: 9090 failureThreshold: 3 successThreshold: 1 periodSeconds: 5 initialDelaySeconds: 5 timeoutSeconds: 5 livenessProbe: httpGet: path: /-/healthy port: 9090 failureThreshold: 3 successThreshold: 1 periodSeconds: 5 initialDelaySeconds: 15 timeoutSeconds: 5 volumes: - name: prometheus-config configMap: name: prometheus-config - name: prometheus-storage-volume emptyDir: {}Prometheus-PushGateway
[root@k8s-master-1 pushgateway]# cat prometheus-pushgateway.yaml apiVersion: v1kind: Servicemetadata: name: prometheus-pushgateway namespace: kube-prometheusspec: selector: name: prometheus-pushgateway type: NodePort ports: - port: 9091 targetPort: 9091 nodePort: 42000---apiVersion: apps/v1kind: Deploymentmetadata: name: prometheus-pushgateway namespace: kube-prometheus labels: name: prometheus-pushgateway spec: selector: matchLabels: name: prometheus-pushgateway template: metadata: labels: name: prometheus-pushgateway spec: nodeName: k8s-node-1 # 指定在Work节点运行 hostNetwork: true # 将容器端口在宿主机内暴露出来 containers: - name: pushgateway image: prom/pushgateway:v1.4.2 ports: - containerPort: 9091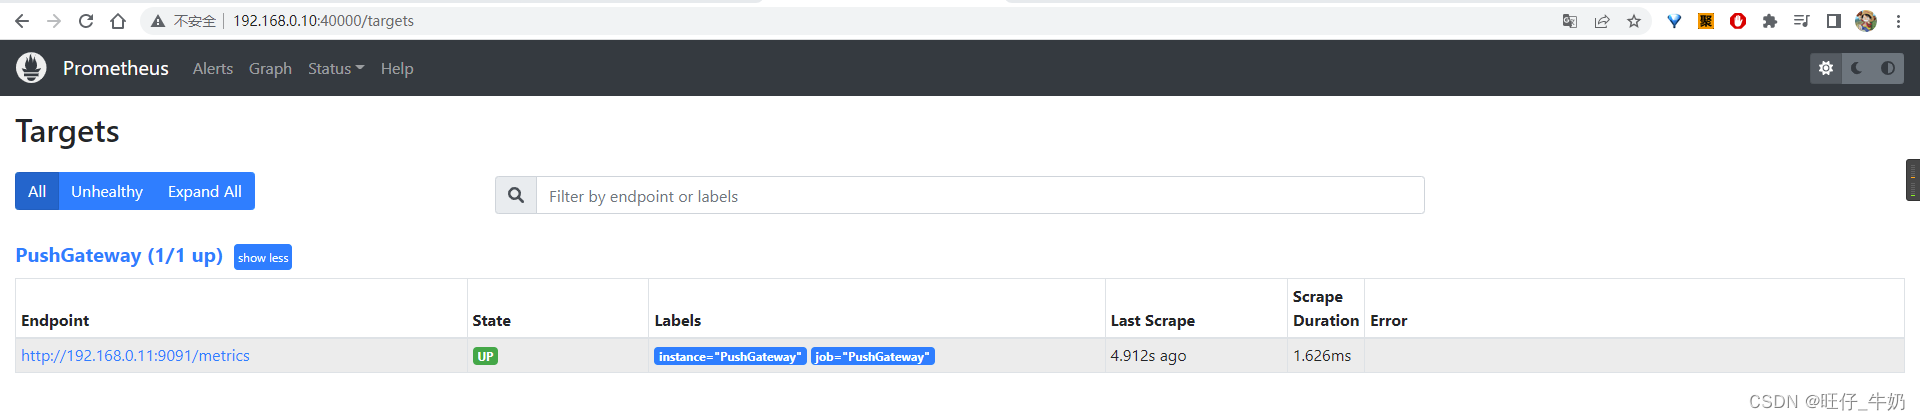
发送数据给PushGateway
# 将k8s-master-1 的 node_exporter metrics 发送给pushgateway[root@k8s-node-1 ~]# curl k8s-master-1:9100/metrics | curl --data-binary @- http://192.168.0.11:9091/metrics/job/k8s_master_1_node_exporter/label1/value1/label2/value2 % Total % Received % Xferd Average Speed Time Time Time Current Dload Upload Total Spent Left Speed100 84411 0 84411 0 0 4132k 0 --:--:-- --:--:-- --:--:-- 4338k# 将k8s-node-1 的 node_exporter metrics 发送给pushgateway[root@k8s-node-1 ~]# curl k8s-node-1:9100/metrics | curl --data-binary @- http://192.168.0.11:9091/metrics/job/k8s_node_1_node_exporter/label1/value1/label2/value2 % Total % Received % Xferd Average Speed Time Time Time Current Dload Upload Total Spent Left Speed100 74858 0 74858 0 0 4897k 0 --:--:-- --:--:-- --:--:-- 5221k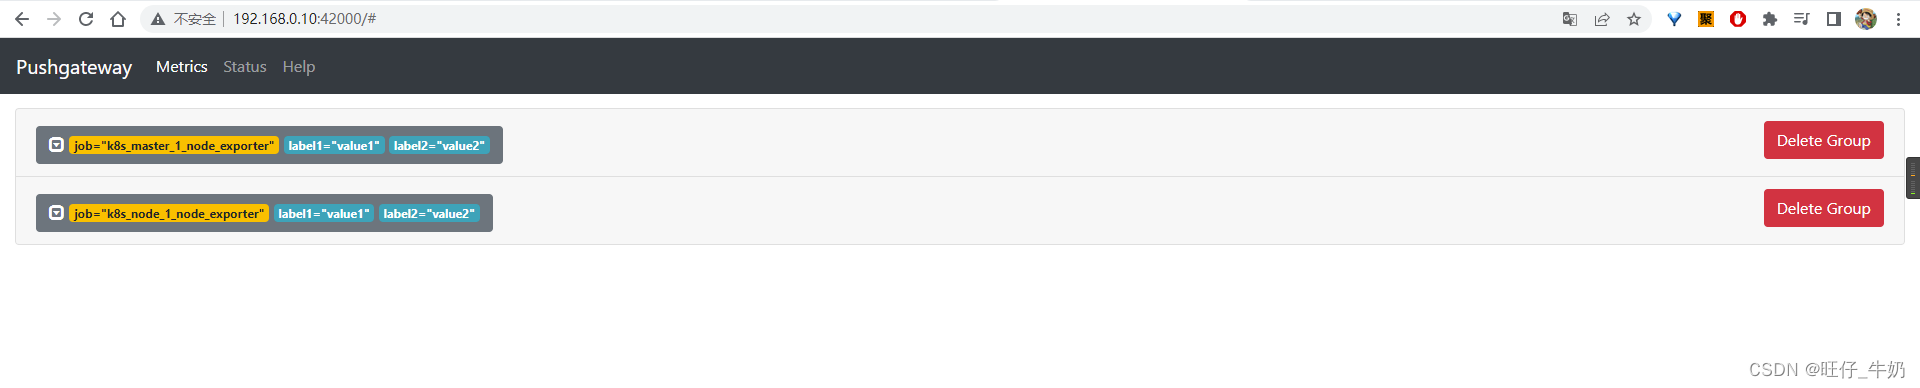
可以发现,二次上传的数据均传到prometheus-pushgateway
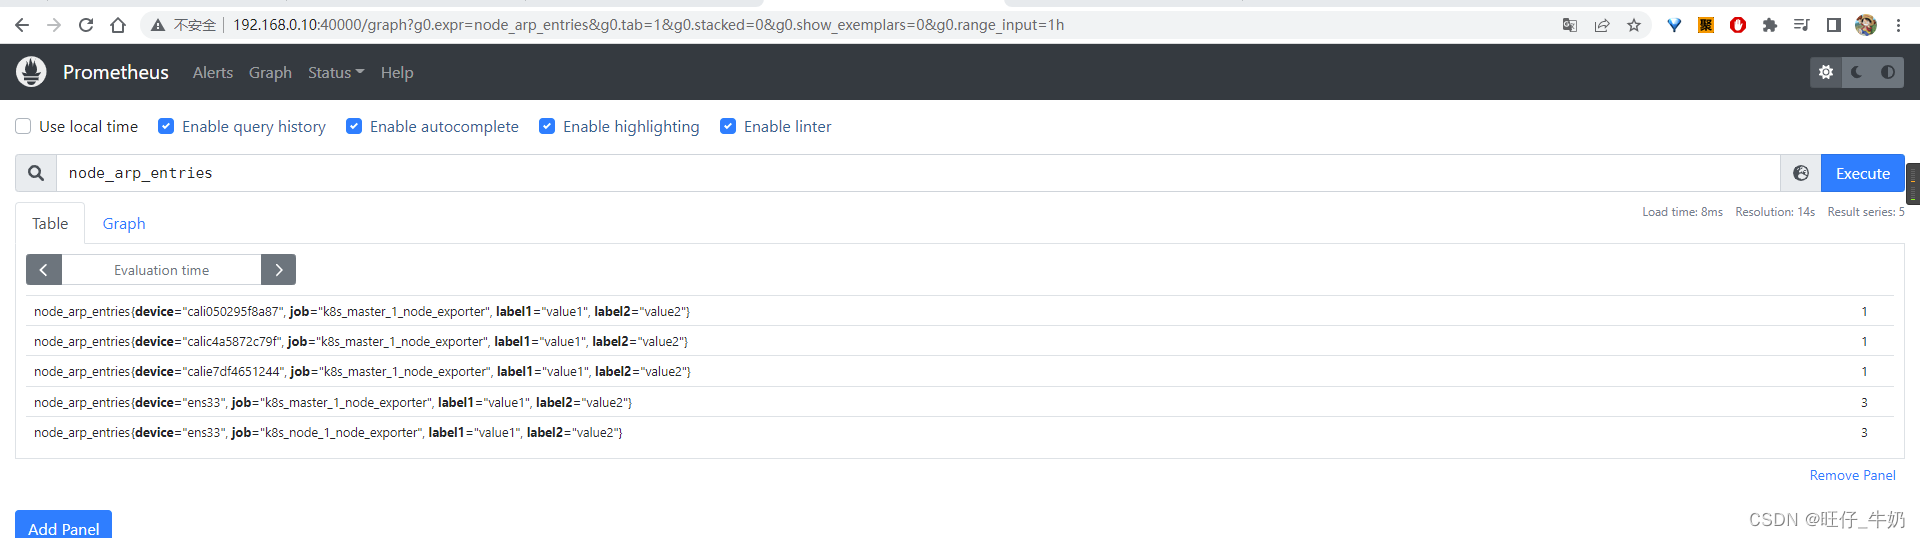
可以发现prometheus-server通过pushgateway拿到我们手动发送的数据了

