使用OxyPlot绘制曲线
OxyPlot 是一个用于 .NET 的 2D 绘图库,自 2010 年以来一直在积极开发。OxyPlot 获得 MIT 许可,并具有用于大量现代平台(WinForms、WPF、UWP、Xamarin、XWT)和一些旧平台(Silveright)的组件和 Windows 系统)。WinForms 控件 (PlotView.cs) 使用 System.Drawing 进行渲染,但也存在使用 SkiaSharp 和 ImageSharp 的渲染系统。创建 OxyPlot 是为了绘制 2D 数据,这就是它名称中包含“xy”的原因。
交互式控件
- 左键单击显示光标下点的 X/Y 值
- 右键单击拖动以平移
- 鼠标滚轮滚动缩放
- 鼠标滚轮在轴上滚动以放大一个轴
快速开始
- 创建 Windows 窗体应用程序
- 在NuGet添加
OxyPlot.WindowsForms - 将
PlotView工具箱中的 a 拖到表单上
生成样本数据
此代码生成我们可以练习绘图的随机数据
private Random rand = new Random(0);private double[] RandomWalk(int points = 5, double start = 100, double mult = 50){ // return an array of difting random numbers double[] values = new double[points]; values[0] = start; for (int i = 1; i < points; i++) values[i] = values[i - 1] + (rand.NextDouble() - .5) * mult; return values;}散点图
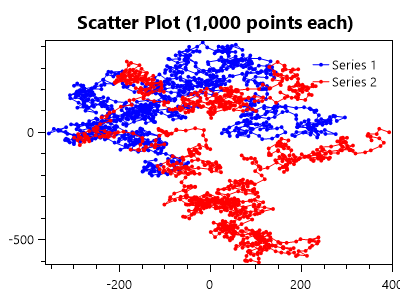
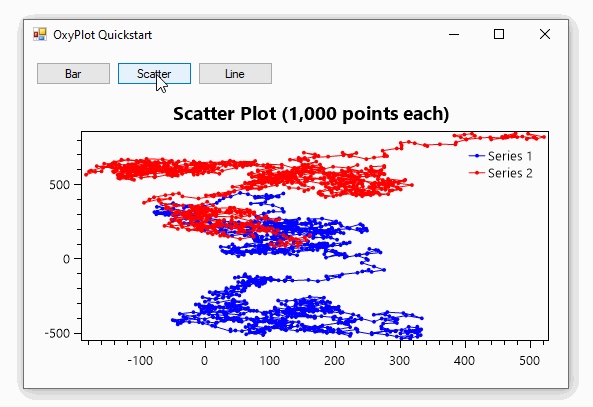
与 OxyPlot 的交互是通过构建数据对象并传递它们来实现的。绘制数据需要创建数据系列对象(如线条和条形),用数据填充它们,然后将它们放入绘图模型中,然后将该模型加载到视图中(如用户控件)。
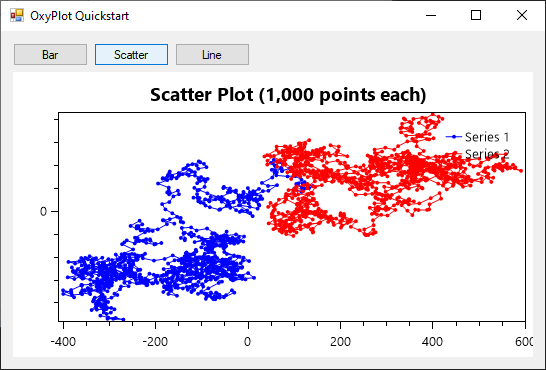
int pointCount = 1000;double[] xs1 = RandomWalk(pointCount);double[] ys1 = RandomWalk(pointCount);double[] xs2 = RandomWalk(pointCount);double[] ys2 = RandomWalk(pointCount);// create lines and fill them with data pointsvar line1 = new OxyPlot.Series.LineSeries(){ Title = $"Series 1", Color = OxyPlot.OxyColors.Blue, StrokeThickness = 1, MarkerSize = 2, MarkerType = OxyPlot.MarkerType.Circle};var line2 = new OxyPlot.Series.LineSeries(){ Title = $"Series 2", Color = OxyPlot.OxyColors.Red, StrokeThickness = 1, MarkerSize = 2, MarkerType = OxyPlot.MarkerType.Circle};for (int i = 0; i < pointCount; i++){ line1.Points.Add(new OxyPlot.DataPoint(xs1[i], ys1[i])); line2.Points.Add(new OxyPlot.DataPoint(xs2[i], ys2[i]));}// create the model and add the lines to itvar model = new OxyPlot.PlotModel{ Title = $"Scatter Plot ({pointCount:N0} points each)"};model.Series.Add(line1);model.Series.Add(line2);// load the model into the user controlplotView1.Model = model;条状图
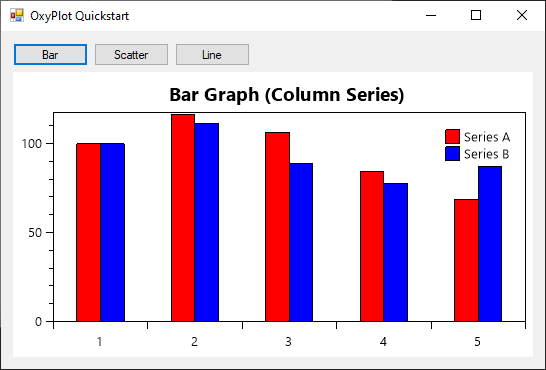
int pointCount = 5;double[] ys1 = RandomWalk(pointCount);double[] ys2 = RandomWalk(pointCount);// create a series of bars and populate them with datavar seriesA = new OxyPlot.Series.ColumnSeries(){ Title = "Series A", StrokeColor = OxyPlot.OxyColors.Black, FillColor = OxyPlot.OxyColors.Red, StrokeThickness = 1};var seriesB = new OxyPlot.Series.ColumnSeries(){ Title = "Series B", StrokeColor = OxyPlot.OxyColors.Black, FillColor = OxyPlot.OxyColors.Blue, StrokeThickness = 1};for (int i = 0; i < pointCount; i++){ seriesA.Items.Add(new OxyPlot.Series.ColumnItem(ys1[i], i)); seriesB.Items.Add(new OxyPlot.Series.ColumnItem(ys2[i], i));}// create a model and add the bars into itvar model = new OxyPlot.PlotModel{ Title = "Bar Graph (Column Series)"};model.Axes.Add(new OxyPlot.Axes.CategoryAxis());model.Series.Add(seriesA);model.Series.Add(seriesB);// load the model into the user controlplotView1.Model = model;表现
我发现线图相对较快(以几 FPS 的速度显示 100 万个点)。
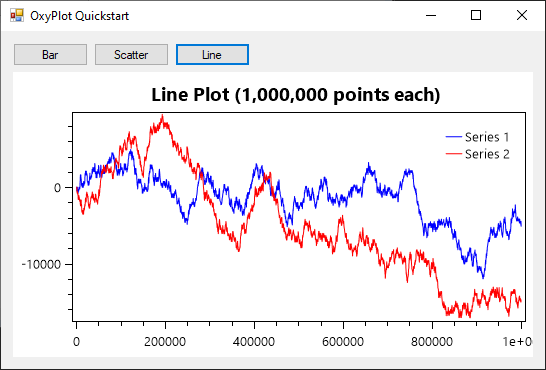
int pointCount = 1000000;double[] xs = Consecutive(pointCount);double[] ys1 = RandomWalk(pointCount);double[] ys2 = RandomWalk(pointCount);// create lines and fill them with data pointsvar line1 = new OxyPlot.Series.LineSeries(){ Title = $"Series 1", Color = OxyPlot.OxyColors.Blue, StrokeThickness = 1,};var line2 = new OxyPlot.Series.LineSeries(){ Title = $"Series 2", Color = OxyPlot.OxyColors.Red, StrokeThickness = 1,};for (int i = 0; i < pointCount; i++){ line1.Points.Add(new OxyPlot.DataPoint(xs[i], ys1[i])); line2.Points.Add(new OxyPlot.DataPoint(xs[i], ys2[i]));}// create the model and add the lines to itvar model = new OxyPlot.PlotModel{ Title = $"Line Plot ({pointCount:N0} points each)"};model.Series.Add(line1);model.Series.Add(line2);// load the model into the user controlplotView1.Model = model;在控制台应用程序中创建绘图
要在控制台应用程序中使用 OxyPlot,请像以前一样创建模型,但使用文件导出器将模型保存到文件中,而不是在用户控件中显示它。
OxyPlot.WindowsForms.PngExporter.Export(model, "test.png", 400, 300, OxyPlot.OxyColors.White);PngExporter您安装的任何 NuGet 包都提供了特定于平台的功能。此代码示例使用包PngExporter中的OxyPlot.WindowsForms,但安装OxyPlot.Core.Drawing可能是真正的控制台应用程序的方式。