Python图像绘制基础——子图绘制
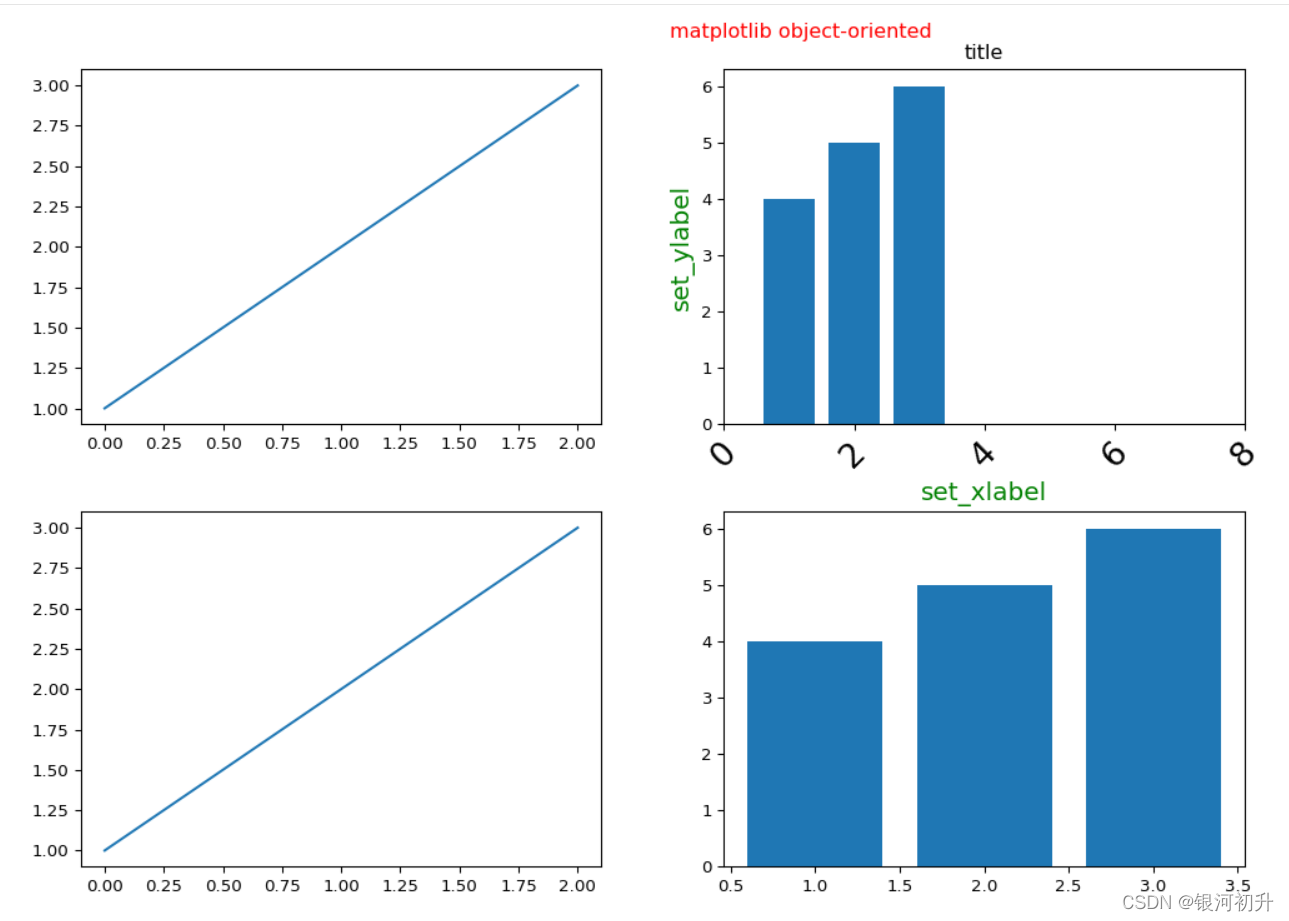
import matplotlib.pyplot as pltmy_dpi = 96fig, axs = plt.subplots(2, 2, figsize=(480 / my_dpi, 480 / my_dpi), dpi=my_dpi, sharex=False, # x轴刻度值共享开启 sharey=False, # y轴刻度值共享关闭 )# fig为matplotlib.figure.Figure对象# axs为matplotlib.axes.Axes,把fig分成2x2的子图axs[0][0].plot([1, 2, 3])axs[0][1].bar([1, 2, 3], [4, 5, 6])axs[0][1].set(title='title') # 设置axes及子图标题axs[0][1].set_xlabel('set_xlabel', fontsize=15, color='g') # 设置x轴刻度标签axs[0][1].set_ylabel('set_ylabel', fontsize=15, color='g') # 设置y轴刻度标签axs[0][1].set_xlim(0, 8) # 设置x轴刻度范围axs[0][1].set_xticks(range(0, 10, 2)) # 设置x轴刻度间距axs[0][1].tick_params(axis='x', # 可选'y','both' labelsize=20, rotation=45) # x轴标签旋转、字号等axs[1][0].plot([1, 2, 3])axs[1][1].bar([1, 2, 3], [4, 5, 6])fig.suptitle('matplotlib object-oriented', color='r') # 设置fig即整整张图的标题# 修改子图在整个figure中的位置(上下左右)plt.subplots_adjust(left=0.125, bottom=-0.61, right=1.3, # 防止右边子图y轴标题与左边子图重叠 top=0.88, wspace=0.2, hspace=0.2 )# 参数介绍'''## The figure subplot parameters. All dimensions are a fraction of the figure width and height.#figure.subplot.left: 0.125 # the left side of the subplots of the figure#figure.subplot.right: 0.9 # the right side of the subplots of the figure#figure.subplot.bottom: 0.11 # the bottom of the subplots of the figure#figure.subplot.top: 0.88 # the top of the subplots of the figure#figure.subplot.wspace: 0.2 # the amount of width reserved for space between subplots, # expressed as a fraction of the average axis width#figure.subplot.hspace: 0.2 # the amount of height reserved for space between subplots, # expressed as a fraction of the average axis height'''plt.show()具体代码和注释已给出,下图是运行效果: