零前端?3分钟上线!用Streamlit把AI模型变「可点击」的神器
Streamlit是一个开源的用于开发Python程序的框架,可以通过几行代码将逻辑转换为Web应用程序:
-
Streamlit并不需要开发者拥有前端知识
-
Streamlit包含了丰富的数据展示形式
-
通过Python代码可控制应用运行逻辑
在本文中我们将介绍Streamlit的基础知识,以及如何使用Streamlit去搭建和部署机器学习模型。
官网链接:https://streamlit.io/
官方文档:https://docs.streamlit.io/
streamlit介绍
A faster way to build and share data apps
Streamlit可在几分钟内将数据脚本转变为可共享的网络应用程序。首先我们需要在本地配置Streamlit,推荐如下环境配置:
-
Python3.7+
-
Windows下推荐Conda环境
通过pip安装:
pip install streamlit运行Hello World,默认在8501端口:
streamlit hello如果将代码编写在myfile.py文件,则可以在命令行运行:
streamlit run myfile.py接下来我们将使用Streamlit编写使用随机森林对Iris进行分类的代码:
import streamlit as stimport pandas as pdfrom sklearn import datasetsfrom sklearn.ensemble import RandomForestClassifier# 用户输入数据def user_input_features(): sepal_length = st.sidebar.slider(\'Sepal length\', 4.3, 7.9, 5.4) sepal_width = st.sidebar.slider(\'Sepal width\', 2.0, 4.4, 3.4) petal_length = st.sidebar.slider(\'Petal length\', 1.0, 6.9, 1.3) petal_width = st.sidebar.slider(\'Petal width\', 0.1, 2.5, 0.2) data = {\'sepal_length\': sepal_length, \'sepal_width\': sepal_width, \'petal_length\': petal_length, \'petal_width\': petal_width} features = pd.DataFrame(data, index=[0]) return featuresdf = user_input_features()# 加载Iris并训练模型iris = datasets.load_iris()X = iris.dataY = iris.targetclf = RandomForestClassifier()clf.fit(X, Y)# 对输入数据进行分类,并进行展示prediction = clf.predict(df)prediction_proba = clf.predict_proba(df)st.write(\'分类结果:\' + iris.target_names[prediction][0])如下图为运行结果展示,用户可以在网页修改输入的特征数值,然后每次都输入的样本进行分类。
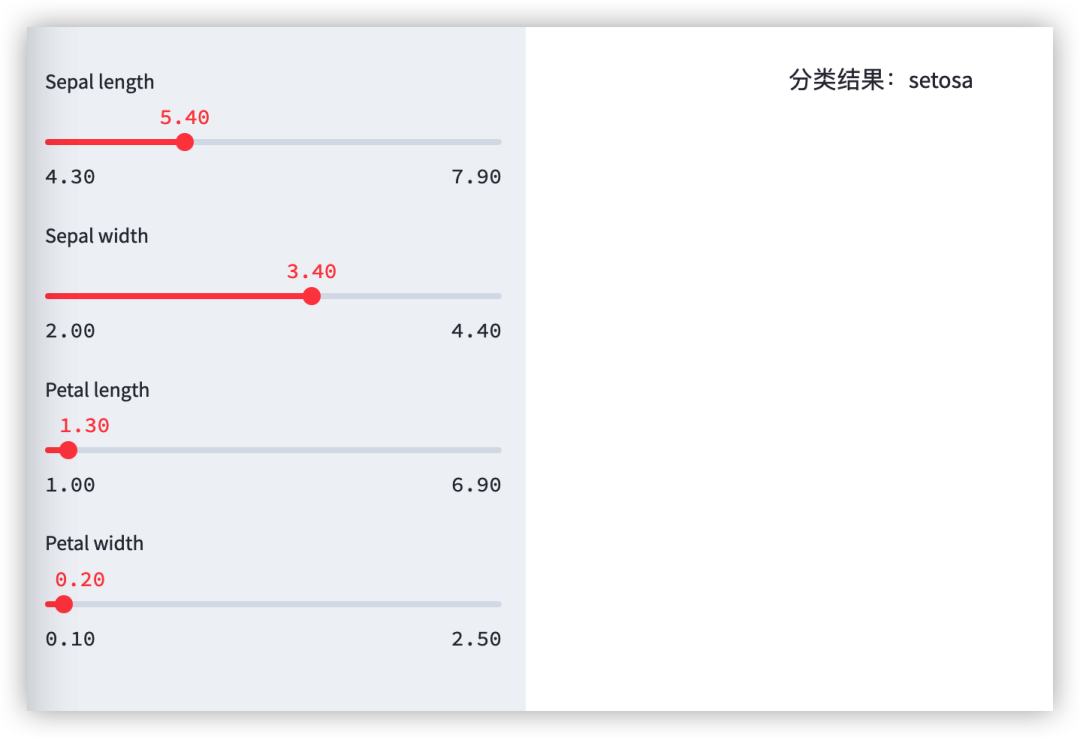
通过运行上述逻辑,我们可以发现:
-
用
Streamlit获取输入非常简单 -
Streamlit运行和Python逻辑相同 -
输入发生改变,代码将重新运行。
Streamlit包含的组件并不是很多,主要可以划分为如下几个模块API:
-
数据展示
-
数据输入
-
流程和UI设置
streamlit API介绍
数据展示API
write函数
https://docs.streamlit.io/library/api-reference/write-magic/st.write
st.write可以打印任意格式和类型的对象,但可以传入多个变量。一般情况下,可以打印:
-
字符串
-
Pandas表格
-
函数或模块介绍
-
字典或列表
-
Matplotlib/Altair图表
magic机制
https://docs.streamlit.io/library/api-reference/write-magic/magic
在Streamlit应用中,可以将需要展示的变量直接单独放置在一行,就可以展示其内容。
import streamlit as stimport pandas as pddf = pd.DataFrame({\'col1\': [1,2,3]})df # 👈 Draw the dataframemarkdown函数
https://docs.streamlit.io/library/api-reference/text/st.markdown
st.markdown将字符串打印指定格式:
-
支持
markdown语法 -
支持Emoji表情嵌入
-
支持Latex公式
-
支持颜色设置
import streamlit as stst.markdown(\'Streamlit is **_really_ cool**.\')st.markdown(”This text is :red[colored red], and this is **:blue[colored]** and bold.”)st.markdown(\":green[$\\sqrt{x^2+y^2}=1$] is a Pythagorean identity. :pencil:\")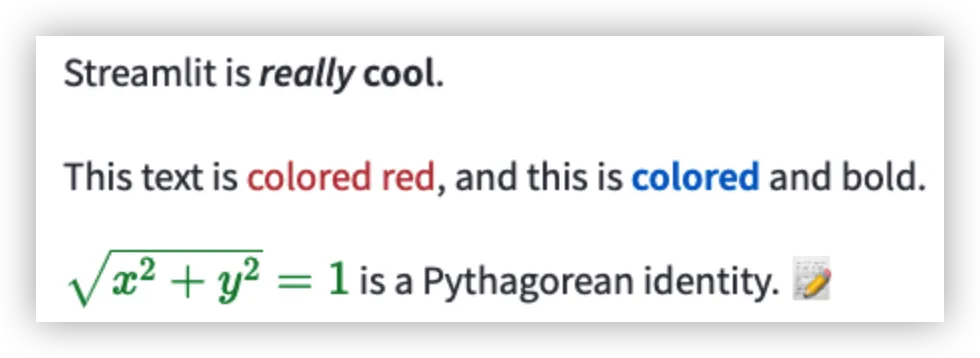
title函数
st.title用于设置应用的标题,支持Emoji、Latex和颜色设置。
header函数
st.header用于设置应用内容的标题,支持Emoji、Latex和颜色设置。
subheader函数
st.header用于设置应用内容的子标题,支持Emoji、Latex和颜色设置。
caption函数
st.caption用于标题、旁白、脚注、旁注和其他解释性文本。
import streamlit as stst.caption(\'This is a string that explains something above.\')st.caption(\'A caption with _italics_ :blue[colors] and emojis :sunglasses:\')
code函数
st.code将代码进行展示,支持多语言。
import streamlit as stcode = \'\'\'def hello(): print(\"Hello, Streamlit!\")\'\'\'st.code(code, language=\'python\')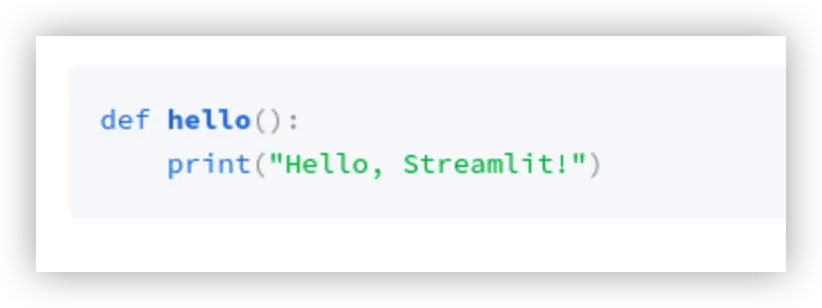
text函数
st.text将文本内容展示为等宽格式。
latext函数
st.latext将在应用中展示公式。
import streamlit as stst.latex(r\'\'\' a + ar + a r^2 + a r^3 + \\cdots + a r^{n-1} = \\sum_{k=0}^{n-1} ar^k = a \\left(\\frac{1-r^{n}}{1-r}\\right) \'\'\')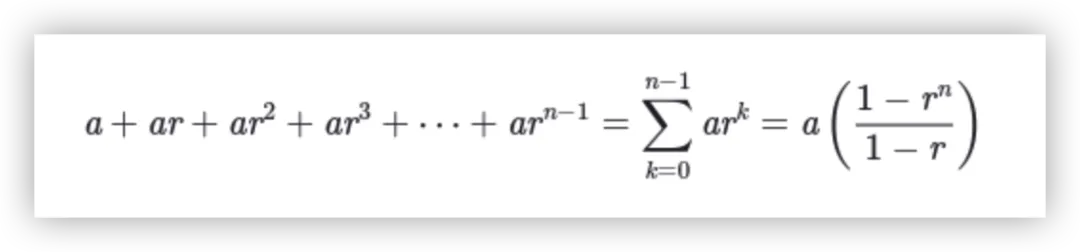
dataframe函数
st.dataframe将Pandas表格进行展示,可以自行设置表格格式、宽度和高度。
import streamlit as stimport pandas as pdimport numpy as npdf = pd.DataFrame( np.random.randn(50, 20), columns=(\'col %d\' % i for i in range(20)))st.dataframe(df) # Same as st.write(df)table函数
st.table将Pandas表格进行静态展示,不支持拖动和内容修改。
import streamlit as stimport pandas as pdimport numpy as npdf = pd.DataFrame( np.random.randn(10, 5), columns=(\'col %d\' % i for i in range(5)))st.table(df)metric函数
st.metric以粗体显示指标,并可选指示指标如何变化。
import streamlit as stst.metric(label=\"Temperature\", value=\"70 °F\", delta=\"1.2 °F\")json函数
st.json将内容进行折叠展示。
import streamlit as stst.json({ \'foo\': \'bar\', \'baz\': \'boz\', \'stuff\': [ \'stuff 1\', \'stuff 2\', \'stuff 3\', \'stuff 5\', ],})line_chart函数
st.line_chart将使用altair展示折线图,支持交互式拖拽、放大和缩小。
import streamlit as stimport pandas as pdimport numpy as npchart_data = pd.DataFrame( np.random.randn(20, 3), columns=[\'a\', \'b\', \'c\'])st.line_chart(chart_data)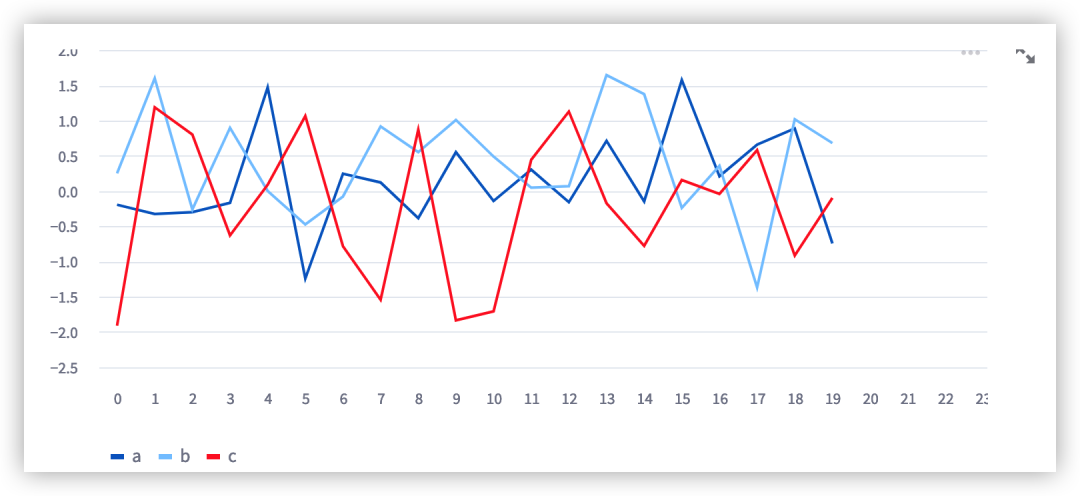
area_chart函数
st.area_chart将使用altair展示面积图,支持交互式拖拽、放大和缩小。
import streamlit as stimport pandas as pdimport numpy as npchart_data = pd.DataFrame( np.random.randn(20, 3), columns=[\'a\', \'b\', \'c\'])st.area_chart(chart_data)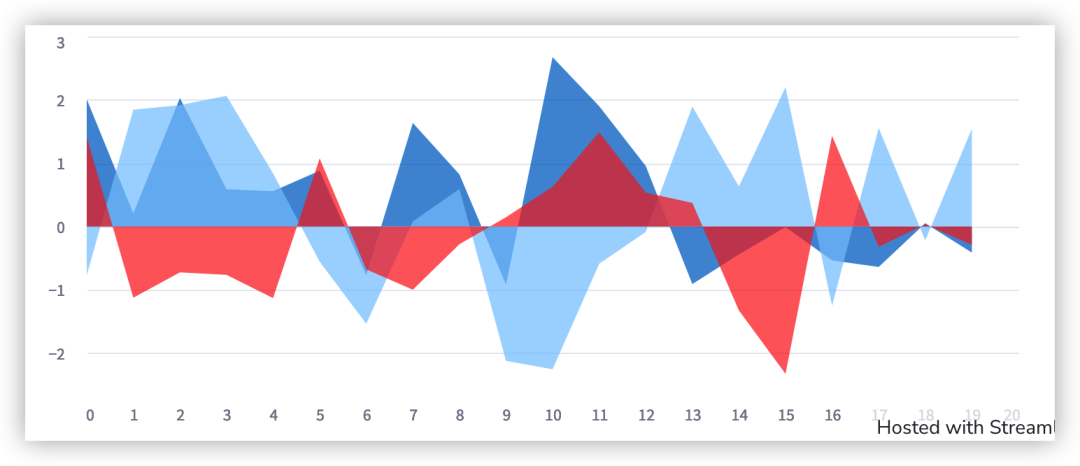
bar_chart函数
st.bar_chart将使用altair展示折线图,支持交互式拖拽、放大和缩小。
import streamlit as stimport pandas as pdimport numpy as npchart_data = pd.DataFrame( np.random.randn(20, 3), columns=[\"a\", \"b\", \"c\"])st.bar_chart(chart_data)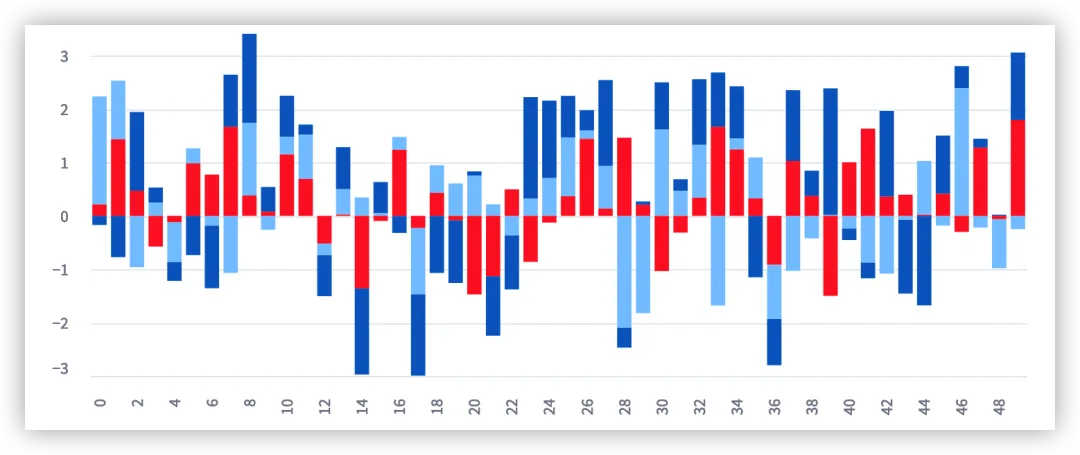
altair_chart函数
st.altair_chart将显示Altair内容,支持交互式拖拽、放大和缩小。
import streamlit as stimport pandas as pdimport numpy as npimport altair as altchart_data = pd.DataFrame( np.random.randn(20, 3), columns=[\'a\', \'b\', \'c\'])c = alt.Chart(chart_data).mark_circle().encode( x=\'a\', y=\'b\', size=\'c\', color=\'c\', tooltip=[\'a\', \'b\', \'c\'])st.altair_chart(c, use_container_width=True)vega_lite_chart函数
st.vega_lite_chart将显示Vega-Lite内容,支持交互式信息展示,但不支持放大和缩小。
import streamlit as stimport pandas as pdimport numpy as npchart_data = pd.DataFrame( np.random.randn(200, 3), columns=[\'a\', \'b\', \'c\'])st.vega_lite_chart(chart_data, { \'mark\': {\'type\': \'circle\', \'tooltip\': True}, \'encoding\': { \'x\': {\'field\': \'a\', \'type\': \'quantitative\'}, \'y\': {\'field\': \'b\', \'type\': \'quantitative\'}, \'size\': {\'field\': \'c\', \'type\': \'quantitative\'}, \'color\': {\'field\': \'c\', \'type\': \'quantitative\'}, },})plotly_chart函数
st.plotly_chart将显示Plotly内容,支持交互式信息展示,支持放大和缩小。
import streamlit as stimport numpy as npimport plotly.figure_factory as ff# Add histogram datax1 = np.random.randn(200) - 2x2 = np.random.randn(200)x3 = np.random.randn(200) + 2# Group data togetherhist_data = [x1, x2, x3]group_labels = [\'Group 1\', \'Group 2\', \'Group 3\']# Create distplot with custom bin_sizefig = ff.create_distplot( hist_data, group_labels, bin_size=[.1, .25, .5])# Plot!st.plotly_chart(fig, use_container_width=True)bokeh_chart函数
st.bokeh_chart将显示Bokeh内容,支持交互式信息展示,支持放大和缩小。
import streamlit as stfrom bokeh.plotting import figurex = [1, 2, 3, 4, 5]y = [6, 7, 2, 4, 5]p = figure( title=\'simple line example\', x_axis_label=\'x\', y_axis_label=\'y\')p.line(x, y, legend_label=\'Trend\', line_width=2)st.bokeh_chart(p, use_container_width=True)pydeck_chart函数
st.pydeck_chart将显示PyDeck内容,主要用于三维地图展示,支持交互和放大缩小。
输入控件API
button函数
st.button将展示可以点击的按钮。
import streamlit as st# 如果按钮点击,则展示hello thereif st.button(\'Say hello\'): st.write(\'Why hello there\')else: st.write(\'Goodbye\')download_button函数
st.download_button数据下载的按钮。
import streamlit as stwith open(\"flower.png\", \"rb\") as file: btn = st.download_button( label=\"Download image\", data=file, file_name=\"flower.png\", mime=\"image/png\" )checkbox函数
st.checkbox展示单选框。
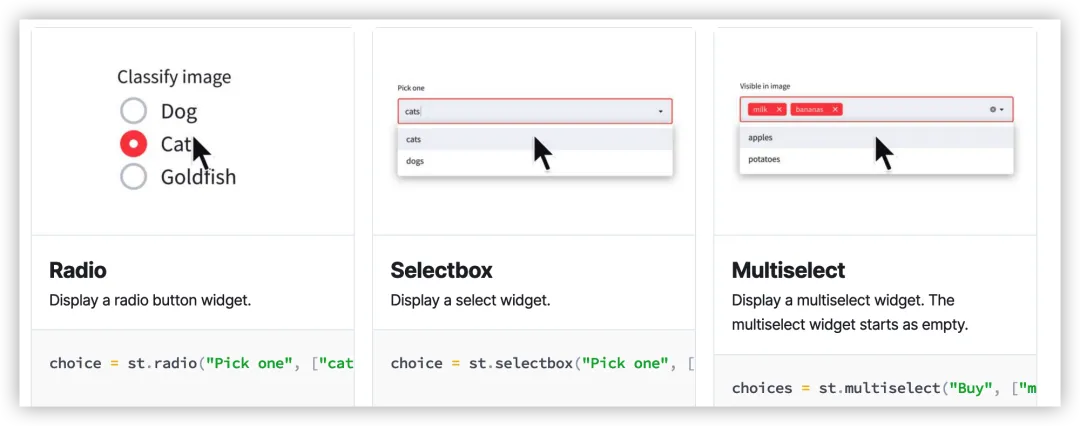
import streamlit as stagree = st.checkbox(\'I agree\')if agree: st.write(\'Great!\')radio函数
st.radio展示多选按钮。
import streamlit as stgenre = st.radio( \"What\\\'s your favorite movie genre\", (\'Comedy\', \'Drama\', \'Documentary\'))if genre == \'Comedy\': st.write(\'You selected comedy.\')else: st.write(\"You didn\\\'t select comedy.\")selectbox
st.selectbox展示下拉选项。
import streamlit as stoption = st.selectbox( \"How would you like to be contacted?\", (\"Email\", \"Home phone\", \"Mobile phone\"))st.write(\'You selected:\', option)multiselect
st.multiselect展示多选下拉选项。
import streamlit as stoptions = st.multiselect( \'What are your favorite colors\', [\'Green\', \'Yellow\', \'Red\', \'Blue\'],)st.write(\'You selected:\', options)slider
st.slider展示数值滑动条。
import streamlit as stage = st.slider(\'How old are you?\', 0, 130, 25)st.write(\"I\'m \", age, \'years old\')select_slider
st.select_slider展示列表滑动条。
import streamlit as stcolor = st.select_slider( \'Select a color of the rainbow\', options=[\'red\', \'orange\', \'yellow\', \'green\', \'blue\', \'indigo\', \'violet\'])st.write(\'My favorite color is\', color)text_input
st.text_input单行文本输入。
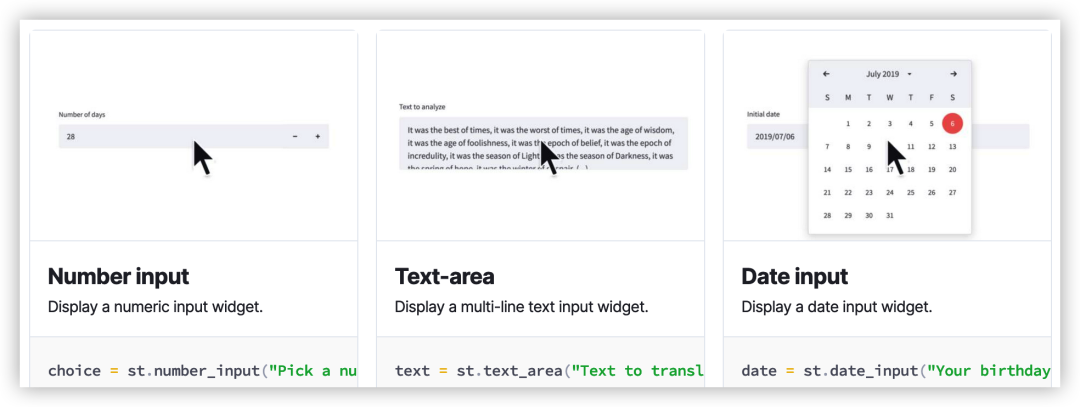
import streamlit as sttitle = st.text_input(\'Movie title\', \'Life of Brian\')st.write(\'The current movie title is\', title)number_input
st.number_input展示数值输入。
import streamlit as stnumber = st.number_input(\'Insert a number\')st.write(\'The current number is \', number)text_area
st.text_area多行文本输入。
import streamlit as sttxt = st.text_area(\'Text to input\')st.write(\'Your input:\', txt)date_input
st.date_input日期输入。
import datetimeimport streamlit as std = st.date_input( \"When\\\'s your birthday\", datetime.date(2019, 7, 6))st.write(\'Your birthday is:\', d)time_input
st.time_input时间输入
import datetimeimport streamlit as stt = st.time_input(\'Set an alarm for\', datetime.time(8, 45))st.write(\'Alarm is set for\', t)file_uploader
st.file_uploader文件上传
import streamlit as stuploaded_files = st.file_uploader(\"Choose a CSV file\", accept_multiple_files=True)for uploaded_file in uploaded_files: bytes_data = uploaded_file.read() st.write(\"filename:\", uploaded_file.name) st.write(bytes_data)camera_input
st.camera_input摄像头拍照
import streamlit as stpicture = st.camera_input(\"Take a picture\")if picture: st.image(picture)color_picker
st.color_picker颜色选择
import streamlit as stcolor = st.color_picker(\'Pick A Color\', \'#00f900\')st.write(\'The current color is\', color)image
st.image展示图片
import streamlit as stfrom PIL import Imageimage = Image.open(\'sunrise.jpg\')st.image(image, caption=\'Sunrise by the mountains\')audio
st.audio展示音频
import streamlit as stimport numpy as npaudio_file = open(\'myaudio.ogg\', \'rb\')audio_bytes = audio_file.read()st.audio(audio_bytes, format=\'audio/ogg\')video
st.video展示视频
import streamlit as stvideo_file = open(\'myvideo.mp4\', \'rb\')video_bytes = video_file.read()st.video(video_bytes)页面布局API
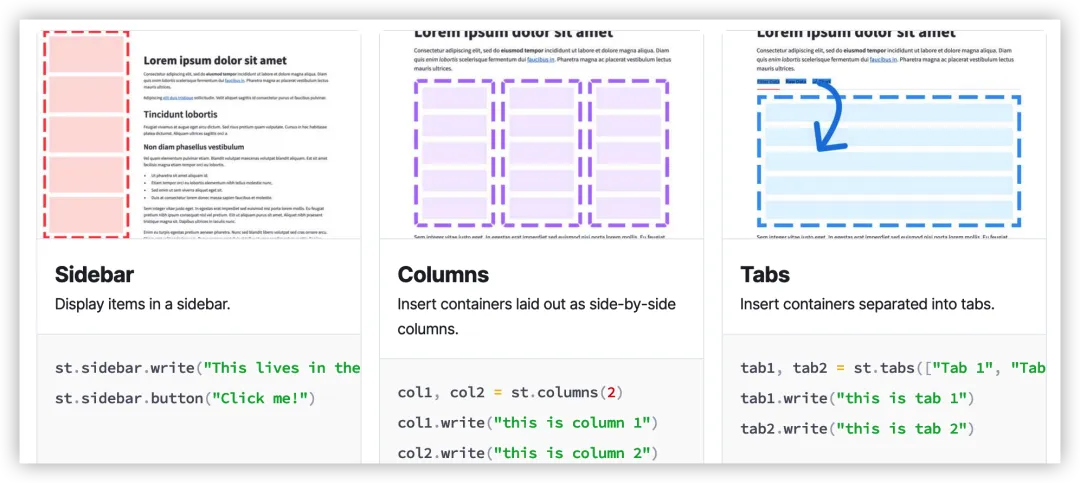
sidebar
st.sidebar展示左侧栏
import streamlit as st# Using object notationadd_selectbox = st.sidebar.selectbox( \"How would you like to be contacted?\", (\"Email\", \"Home phone\", \"Mobile phone\"))# Using \"with\" notationwith st.sidebar: add_radio = st.radio( \"Choose a shipping method\", (\"Standard (5-15 days)\", \"Express (2-5 days)\") )columns
st.columns分列展示内容
import streamlit as stcol1, col2, col3 = st.columns(3)with col1: st.header(\"A cat\") st.image(\"https://static.streamlit.io/examples/cat.jpg\")with col2: st.header(\"A dog\") st.image(\"https://static.streamlit.io/examples/dog.jpg\")with col3: st.header(\"An owl\") st.image(\"https://static.streamlit.io/examples/owl.jpg\")tabs
st.tabs分栏展示内容
import streamlit as sttab1, tab2, tab3 = st.tabs([\"Cat\", \"Dog\", \"Owl\"])with tab1: st.header(\"A cat\") st.image(\"https://static.streamlit.io/examples/cat.jpg\", width=200)with tab2: st.header(\"A dog\") st.image(\"https://static.streamlit.io/examples/dog.jpg\", width=200)with tab3: st.header(\"An owl\") st.image(\"https://static.streamlit.io/examples/owl.jpg\", width=200)expander
st.expander折叠内容
import streamlit as stst.bar_chart({\"data\": [1, 5, 2, 6, 2, 1]})with st.expander(\"See explanation\"): st.write(\\\"\\\"\\\" The chart above shows some numbers I picked for you. I rolled actual dice for these, so they\'re *guaranteed* to be random. \\\"\\\"\\\") st.image(\"https://static.streamlit.io/examples/dice.jpg\")Streamlit状态存储
状态存储
在Streamlit中可以存储当前网页的状态,类似Session的概念。因此可以记录得到用户之前的输入和结果。
# Initializationif \'key\' not in st.session_state: st.session_state[\'key\'] = \'value\'# Session State also supports attribute based syntaxif \'key\' not in st.session_state: st.session_state.key = \'value\'回调函数
当Streamlit的输入控件发生改变时,可以通过on_change或on_click调用回调函数。
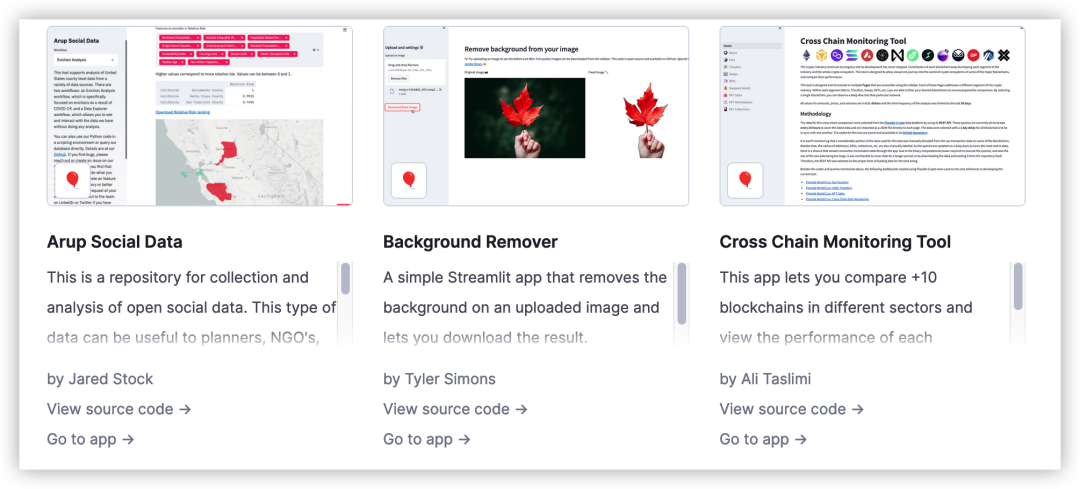
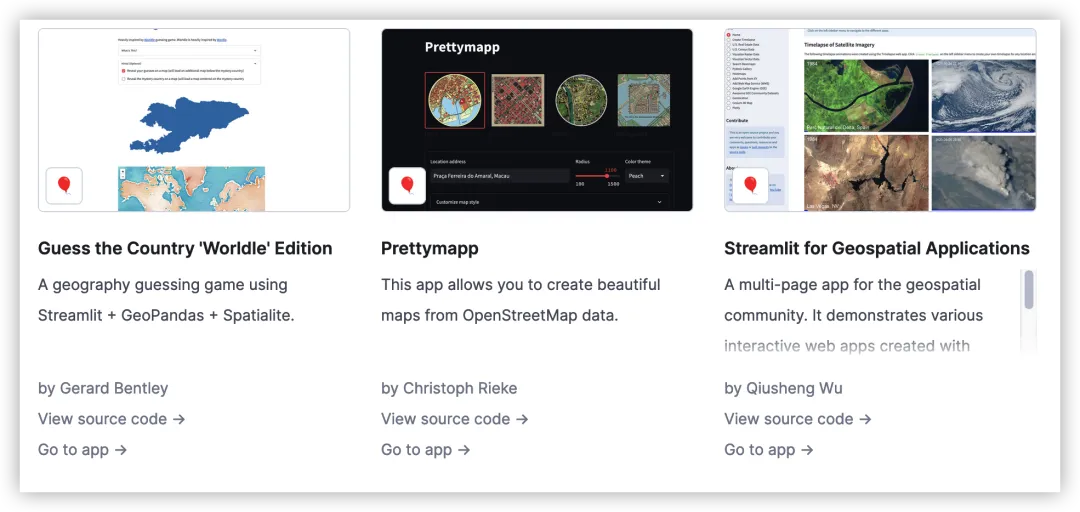
def form_callback(): st.write(st.session_state.my_slider) st.write(st.session_state.my_checkbox)with st.form(key=\'my_form\'): slider_input = st.slider(\'My slider\', 0, 10, 5, key=\'my_slider\') checkbox_input = st.checkbox(\'Yes or No\', key=\'my_checkbox\') submit_button = st.form_submit_button(label=\'Submit\', on_click=form_callback)Streamlit使用案例
https://streamlit.io/gallery
Streamlit部署过程
在本地,可以通过如下代码运行,默认在8501端口:
streamlit run website.py如果想要将streamlit部署在云服务上,并与域名进行绑定,则需要其他的路由转发工具。
这里如希望加入HTTPS的支持,过程稍微复杂一点:
-
首先申请域名对应的SSL证书
-
将证书与域名进行绑定和验证
-
在nginx上配置转发过程
-
在服务器运行streamlit程序


