Prometheus+altermanager搭配钉钉报警_prometheus和altermanager结合配置
一、Prometheus介绍
Prometheus是一个开源系统监控和警报工具包,最初在 SoundCloud构建。自 2012 年成立以来,许多公司和组织都采用了 Prometheus,该项目拥有非常活跃的开发者和用户社区。它现在是一个独立的开源项目,独立于任何公司维护。为了强调这一点,并明确项目的治理结构,Prometheus 于 2016 年加入 云原生计算基金会,成为继Kubernetes之后的第二个托管项目。
Prometheus 将其指标收集并存储为时间序列数据,即指标信息与记录时的时间戳以及称为标签的可选键值对一起存储。
有关 Prometheus 的更详细概述,请参阅 媒体部分链接的资源。
特点
普罗米修斯的主要特点是:
- 具有由度量名称和键/值对标识的时间序列数据的多维数据模型
- PromQL,一种 利用这种维度的灵活查询语言
- 不依赖分布式存储;单个服务器节点是自治的
- 时间序列收集通过 HTTP 上的拉模型进行
- 通过中间网关支持推送时间序列
- 通过服务发现或静态配置发现目标
- 多种图形模式和仪表板支持
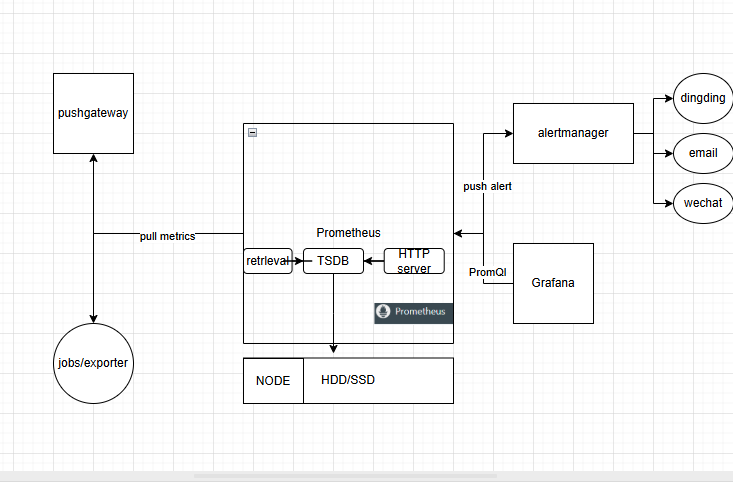
架构图
二、搭建Prometheus监控体系
我这里提前准备了三台虚拟机 (maste、node1、node2)
1、Prometheus 服务端 (master机)
2、expot 客户端(node1、node2)
3、granfan 可视化展示Prometheus数据
1、搭建Prometheus服务端
1.1、下载并解压缩
#下载wget https://github.com/prometheus/prometheus/releases/download/v3.4.0-rc.0/prometheus-3.4.0-rc.0.linux-amd64.tar.gz#解压到 /usr/localtar -xvf prometheus-2.54.0-rc.1.linux-amd64.tar.gz -C /data/#查看版本号cd /data/prometheus-2.54.0-rc.1.linux-amd64/./prometheus --versionprometheus, version 2.54.0-rc.1 (branch: HEAD, revision: 6d7ed08850849c2adcedb63cddeb61fc4f6a425e) build user: root@64a0056e2b2a build date: 20240806-06:01:39 go version: go1.22.5 platform: linux/amd64 tags: netgo,builtinassets,stringlabels1.2、Prometheus.yml配置解释
这里我们可以看到有四个模块1、global 全局配置2、#1、global global: scrape_interval: 15s # Set the scrape interval to every 15 seconds. Default is every 1 minute. evaluation_interval: 15s # Evaluate rules every 15 seconds. The default is every 1 minute. # scrape_timeout is set to the global default (10s).2、1.3、设置systemctl启动
vim /usr/lib/systemd/system/prometheus.service[Unit]Description=https://prometheus.io[Service] ExecStart=/usr/local/prometheus/prometheus --config.file=/usr/local/prometheus/prometheus.yml # 启动地址[Install]WantedBy=multi-user.target1.4、启动Prometheus
#重载systemctl 配置systemctl daemon-reload#设置开机自启systemctl enable prometheus #启动服务systemctl start prometheus1.5、查看是否启动
systemctl status Prometheus1.6、浏览器访问
#开设9090端口号iptables -I INPUT -p tcp -dport 9090 -j ACCEPT#浏览器访问http://172.16.254.190:9090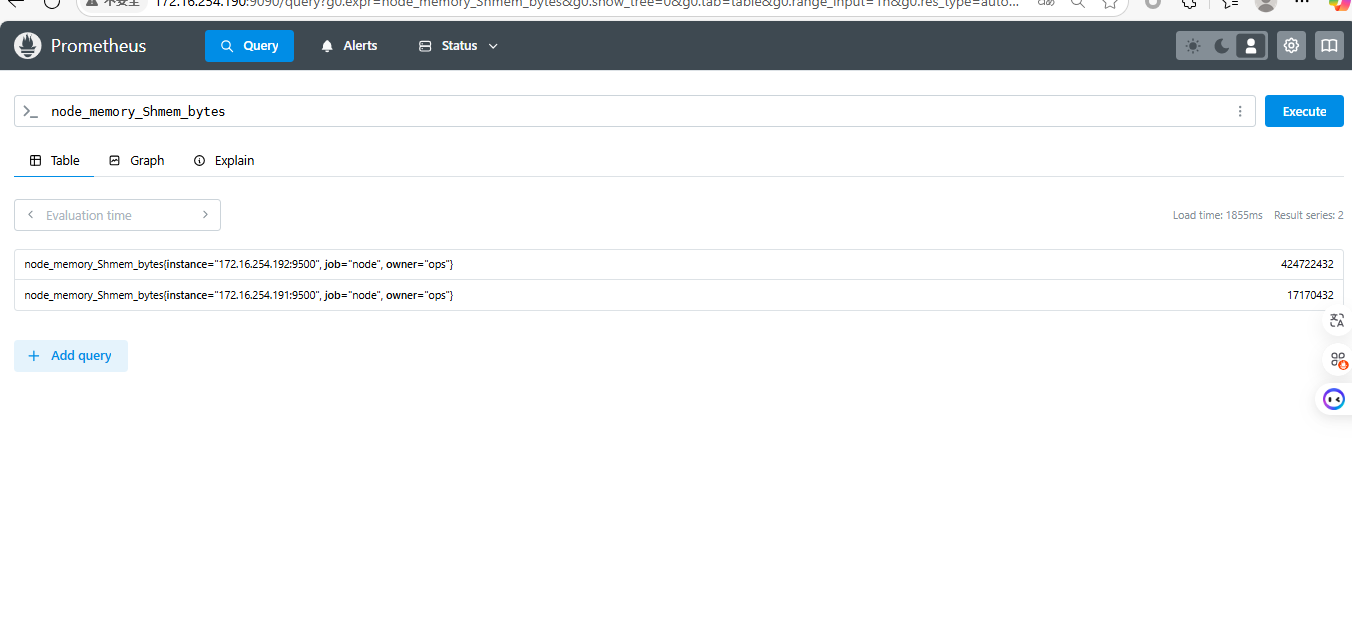
2、搭建客户端export (添加主句监控)
2.1、下载、解压、并启动
切换到node1上
#切换到node1主机上ssh node1#下载wget https://github.com/prometheus/node_exporter/releases/download/v-1.8.2/node_exporter-1.8.2.linux-amd64.tar.gz#解压缩tar -xfv node_exporter-1.8.2.linux-amd64.tar.gz -C /data2.2、设置systemctl 启动
vim /usr/lib/systemd/system/node_exporter.service [Unit]Description=Prometheus-ServerAfter=network.target[Service]ExecStart=/data/node_exporter-1.8.2.linux-amd64/node_exporter --web.listen-address=:9500User=root[Install]WantedBy=multi-user.target/data/node_exporter-1.8.2.linux-amd64/node_exporter --web.listen-address=:95002.3、启动服务
#重载systemctl 配置systemctl daemon-reload#设置开机自启systemctl enable node_exporter#启动服务systemctl start node_exporter2.4、验证是否启动采集到数据
curl http://172.16.254.191:9100/metrics# HELP go_gc_duration_seconds A summary of the pause duration of garbage collection cycles.# TYPE go_gc_duration_seconds summarygo_gc_duration_seconds{quantile=\"0\"} 0go_gc_duration_seconds{quantile=\"0.25\"} 0go_gc_duration_seconds{quantile=\"0.5\"} 0node2主机上也是按照此步骤操作
2.5、修改Prometheus配置文件
- job_name: \"prometheus\" # metrics_path defaults to \'/metrics\' # scheme defaults to \'http\'. static_configs: - targets: [\"localhost:9090\"] - job_name: \"node1\" static_configs: - targets: [\"172.16.254.191:9500\"] labels: service: ops - job_name: \"node2\" static_configs: - targets: [\"172.16.254.192:9500\"] labels: service: ops#- targets 后服务器ip+端口号2.6、重新启动Prometheus
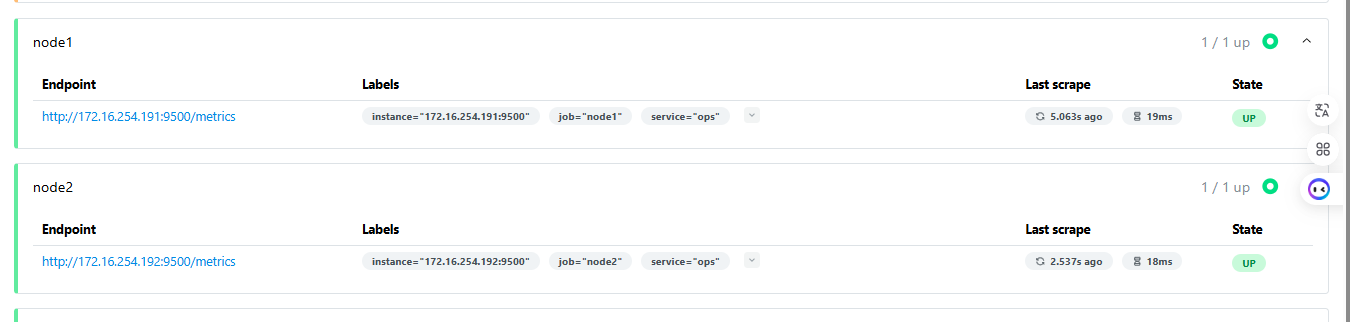
systemctl restart prometheus2.7、浏览器访问Prometheus
http:192.168.19.135/9090我们这里可以看到node1和node2主机已经监控到了
2.8、配置Prometheus规则
在该目录下添加rule规则
先打开Prometheus配置文件,并删除rule注释
vim /data/prometheus-3.1.0.linux-amd64/prometheus.yml# Load rules once and periodically evaluate them according to the global \'evaluation_interval\'.rule_files: - \"first_rules.yml\"# - \"second_rules.yml\"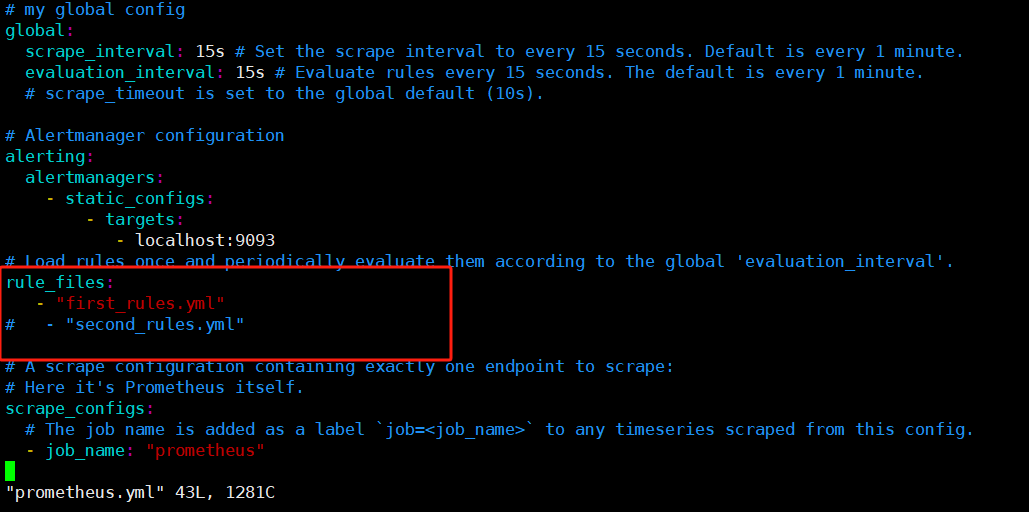
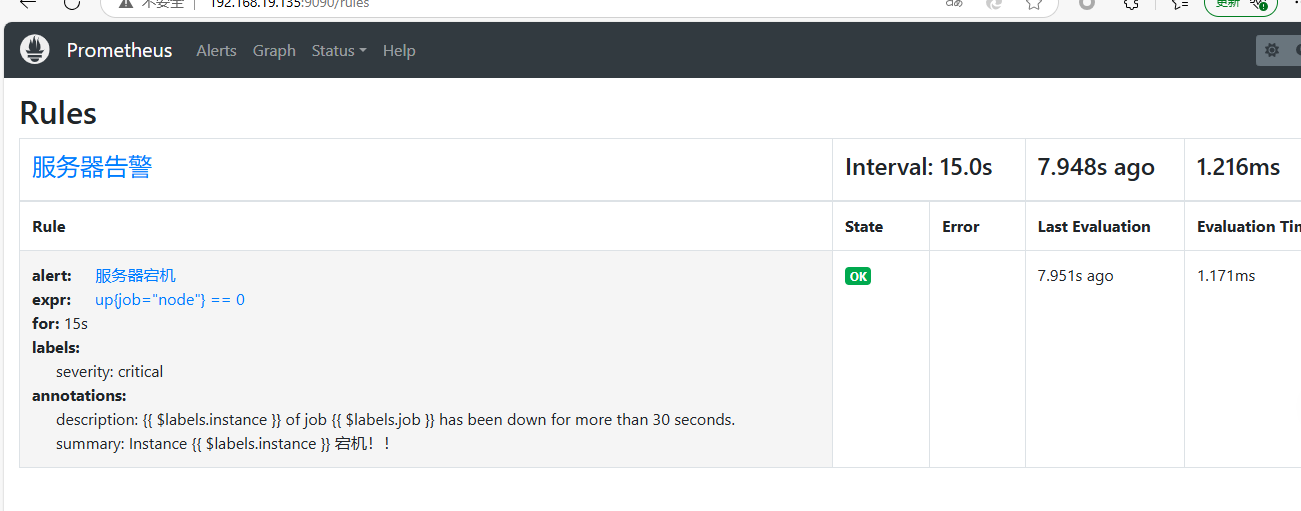
vim /data/prometheus-3.1.0.linux-amd64/first_rules.yml groups:- name: node rules: - alert: InstanceDown expr: up{job=\"node1\"} == 0 for: 15s labels: severity: \"critical\" server: \"ops\" annotations: description: \'{{ $labels.instance }} of job {{ $labels.job }} of service {{ $labels.service }} has been down for more than 30 seconds.\' summary: Instance {{ $labels.instance }} down2.9、重启Prometheus服务
并点击status>rule 下方表示rule设置成功
3、granfan搭建
3.1、下载granfan并启动
yum install -y https://dl.grafana.com/enterprise/release/grafana-enterprise-12.0.2+security~01-1.x86_64.rpmsystemctl start grafana3.2、浏览器访问
#开设3000端口iptables -I INPUT -p tcp --dport 3000 -j ACCEPT浏览器访问http://172.16.254.190:3000/初始用户和密码都为admin admin 第一次会提示修改密码
3.2.1、添加Add data source
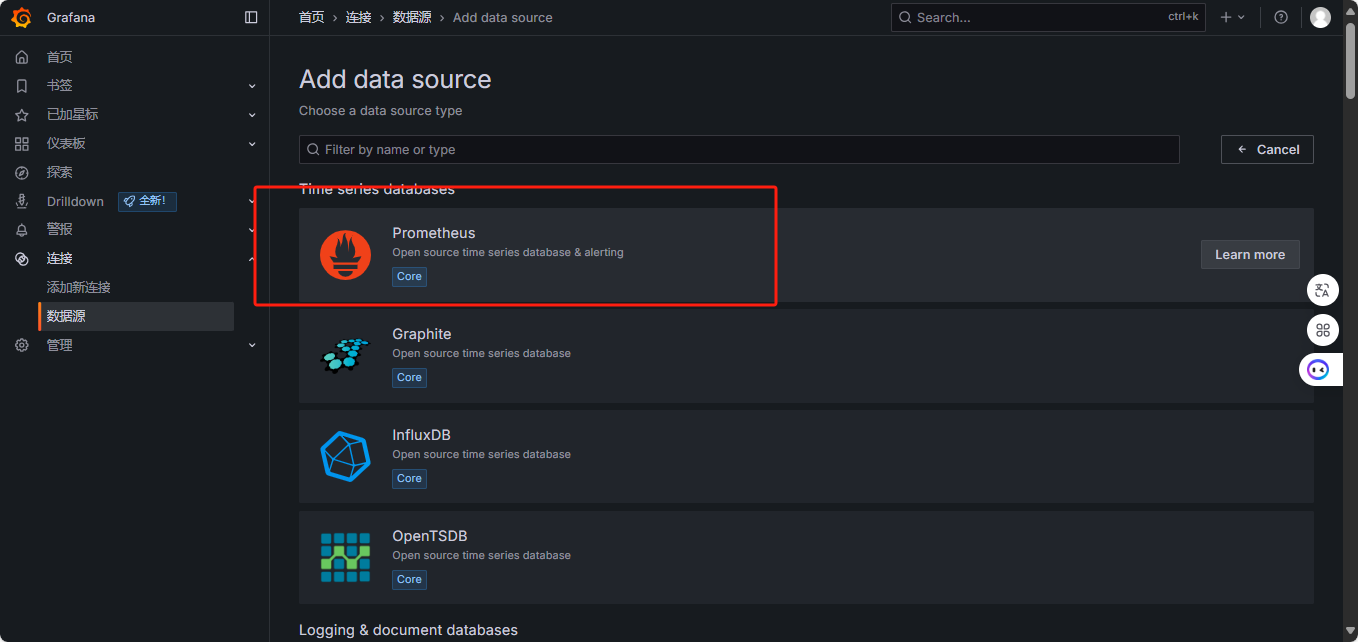
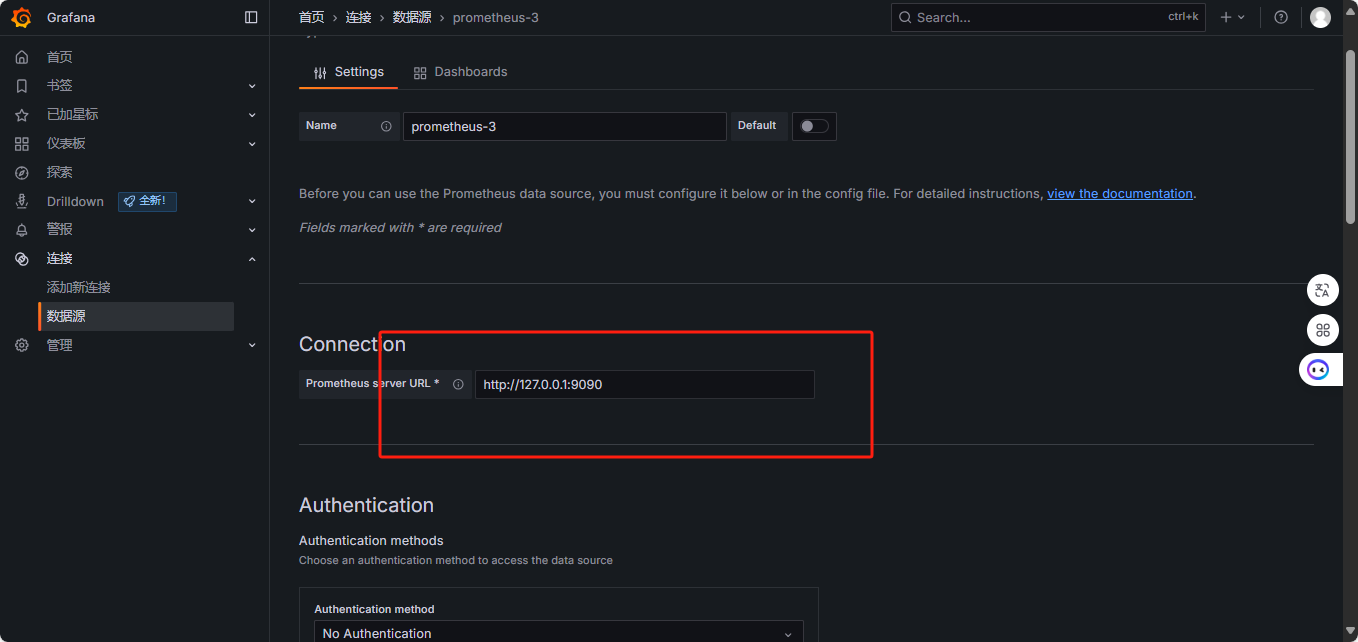
代表成功

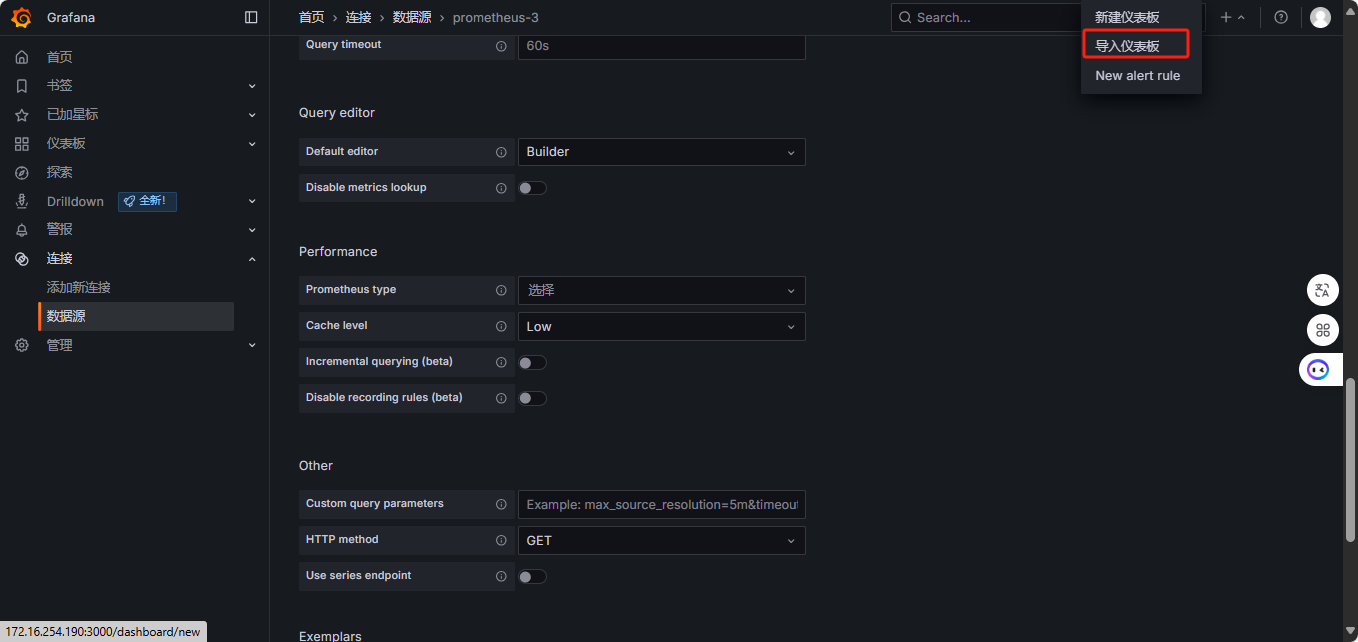
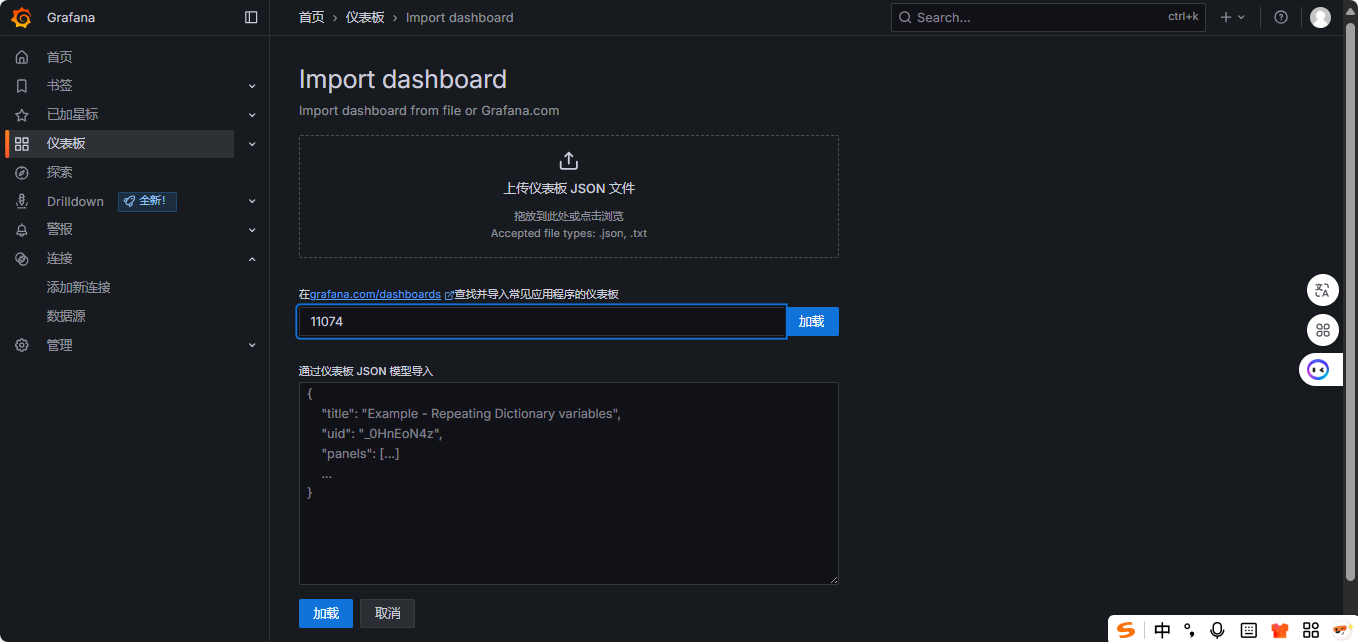
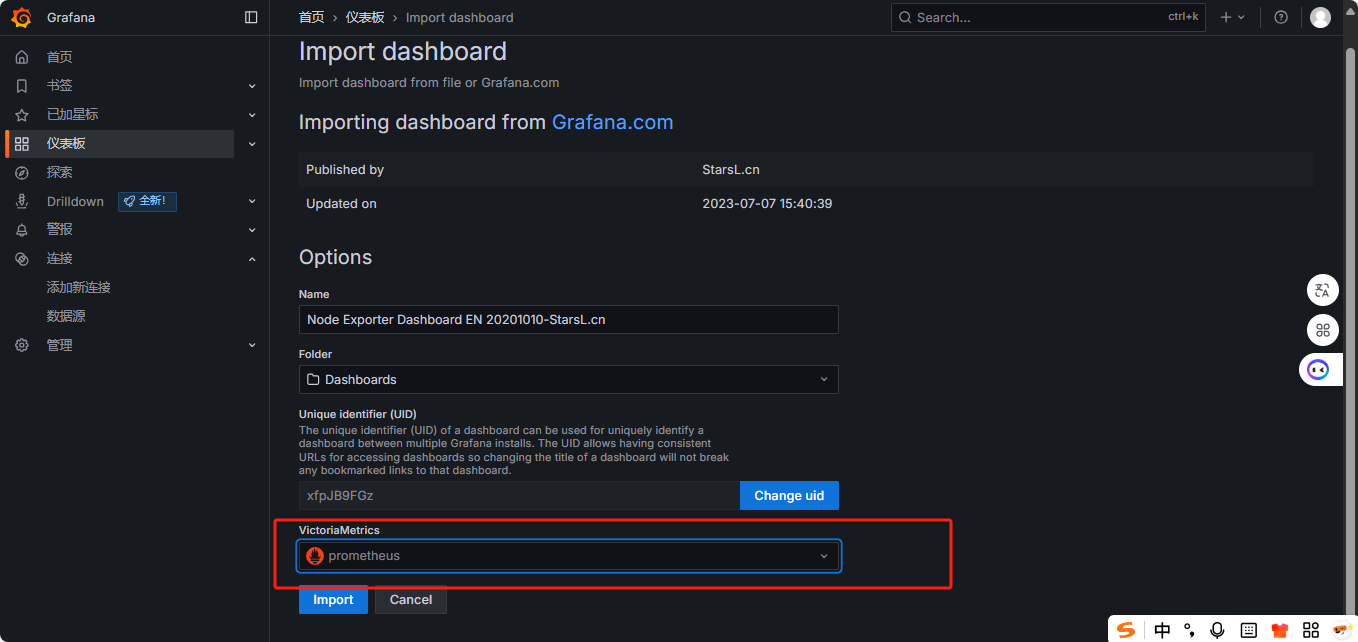
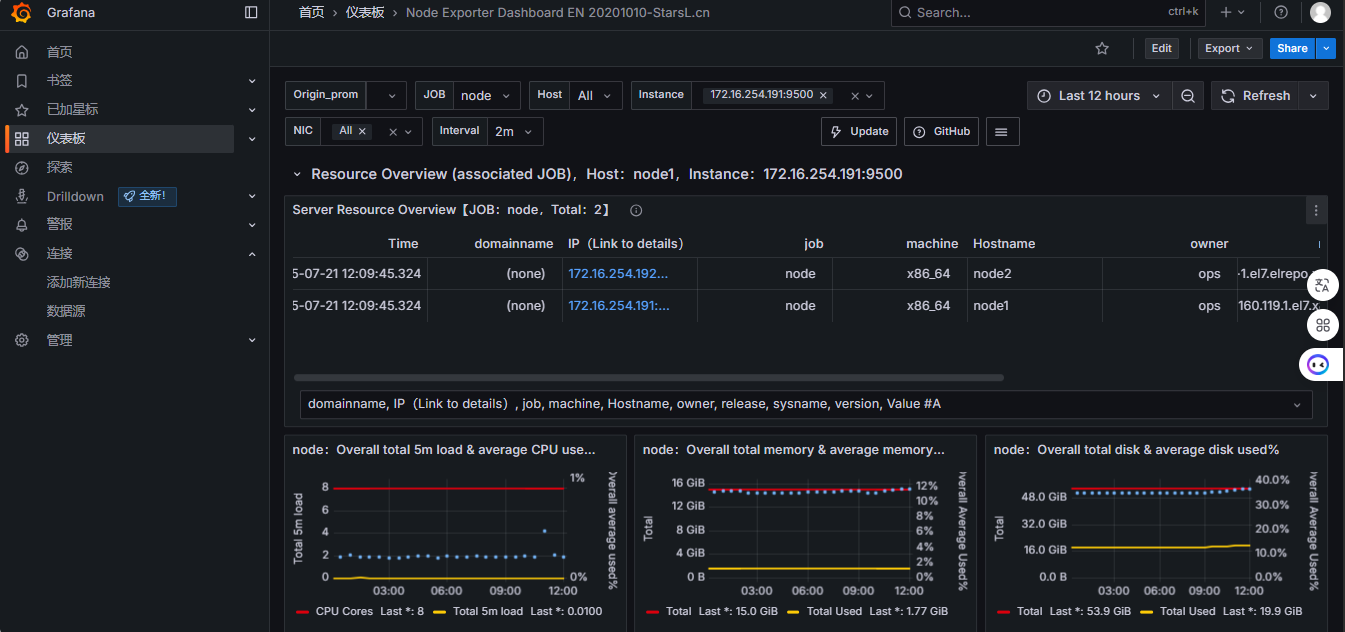
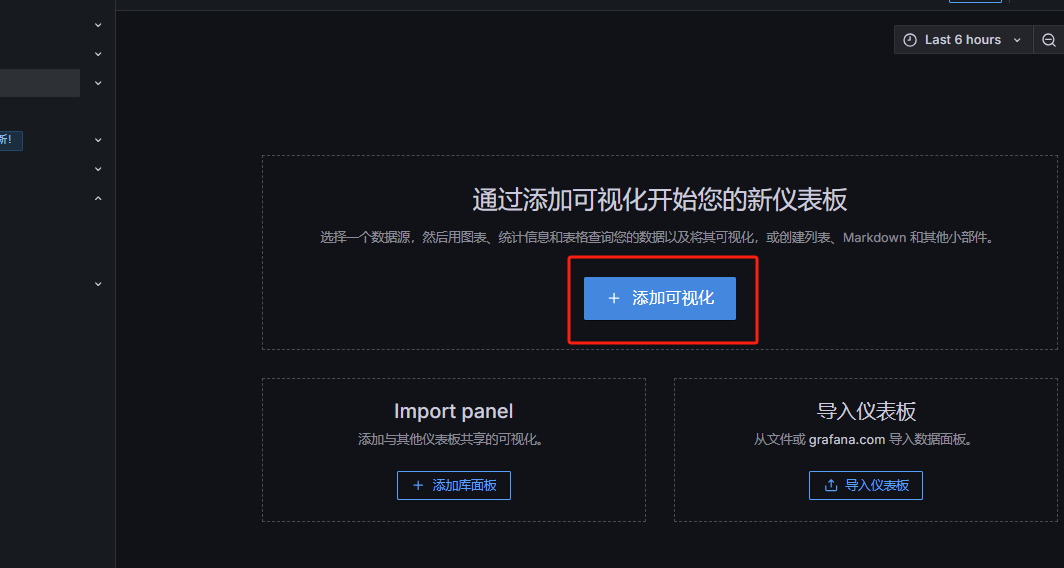
3.2.2、导入仪表盘
添加模版id 11074
4、添加alertmanager报警
4.1下载altermanager并解压缩
在master主机上添加alertmanager
wget https://github.com/prometheus/alertmanager/releases/download/v0.28.0/alertmanager-0.28.1.linux-amd64.tar.gztar -xf alertmanager-0.28.0.linux-amd64.tar.gz -C /data4.2、设置systemctl启动服务
vim /usr/lib/systemd/system/alertmanager.service[unit]Description=Alertmanager-ServerAfter=network.target[Service]ExecStart=/data/alertmanager-0.28.0.linux-amd64/alertmanager --config.file=/data/alertmanager-0.28.0.linux-amd64/alertmanager.ymlUser=root[Install]WantedBy=multi-user.target4.3、启动服务
#重新加载配置文件systemctl daemon-reload#设置开机自启systemctl enable alertmanager.servicesystemctl start alertmanager#查看进程是否启动ps -ef|grep alertmanagerroot 1122 1 0 00:40 ? 00:00:00 /data/alertmanager-0.28.0.linux-amd64/alertmanager --config.file=/data/alertmanager-0.28.0.linux-amd64/alertmanager.ymlroot 1145 27020 0 00:40 pts/3 00:00:00 grep --color=auto alertmanager4.4、可以用webhook.site测试一下是否能触发报警
webhook.site是一个用于测试,转换和自动化web请求和电子邮件平台。他提供多种功能,能创建自定义的webhook URL,接受和查看HTTP请求的详细信息,以及执行自定义的操作。
1、打开链接:(1) Webhook.site - Test, transform and automate Web requests and emails
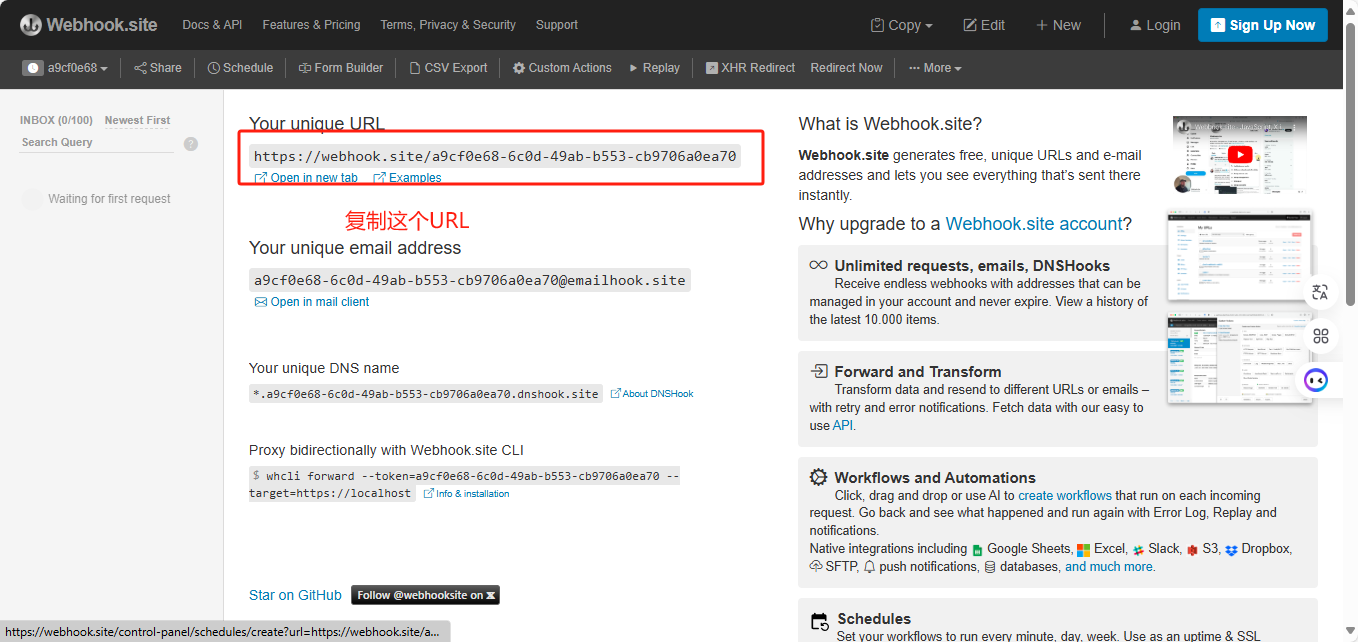
2、打开alertmanager配置文件输入上面复制的url
vim /data/alertmanager-0.28.0.linux-amd64/alertmanager.ymlroute: group_by: [\'alertname\'] group_wait: 30s group_interval: 5m repeat_interval: 1h receiver: \'web.hook\'receivers: - name: \'web.hook\' webhook_configs: - url: \'https://webhook.site/a9cf0e68-6c0d-49ab-b553-cb9706a0ea70\'inhibit_rules: - source_match: severity: \'critical\' target_match: severity: \'warning\' equal: [\'alertname\', \'dev\', \'instance\']3、这时我们登录node1主机关闭node_export 就会自动触发报警
#登录node1ssh node1#关闭node节点systemctl stop node_exporter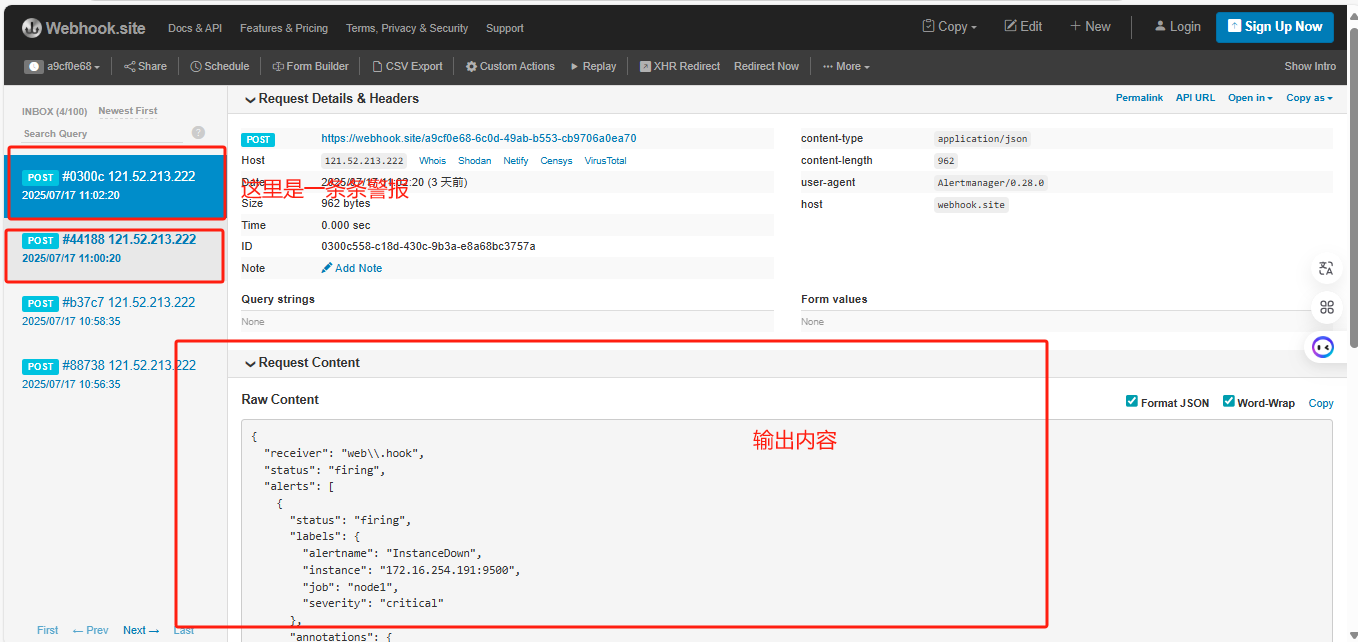
代表Prometheus+alertmanager成功搭建并建立连接。这时我们就可以使用钉钉告警通道触发报警了。
5、钉钉实现报警
5.1、需要下载 Webhook-dingtalk安装并启动
wegt https://github.com/timonwong/prometheus-webhook-dingtalk/releases/download/v2.1.0/prometheus-webhook-dingtalk-2.1.0.linux-amd64.tar.gz#解压tar -xf prometheus-webhook-dingtalk-2.1.0.linux-amd64.tar.gz -C /datacd /data/prometheus-webhook-dingtalk-2.1.0.linux-amd64.tar.gz5.2、添加systemctl管理
vim /usr/lib/systemd/system/webhook.service[Unit]Description=Prometheus-Server[Service]ExecStart=/data/prometheus-webhook-dingtalk-2.1.0.linux-amd64/prometheus-webhook-dingtalk --config.file=/data/prometheus-webhook-dingtalk-2.1.0.linux-amd64/config.example.yml[Install]WantedBy=multi-user.target5.3、设置开机自启并启动服务
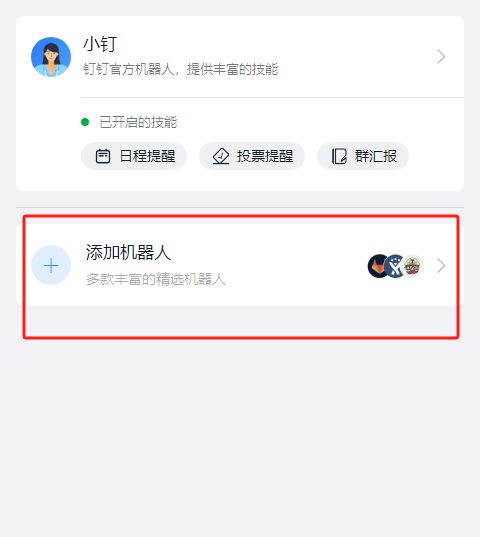
systemctl daemon-reloadsystemctl enable webhooksystemctl start webhook5.4、电脑下载钉钉软件
步骤一:创建群聊添加机器人

步骤二、
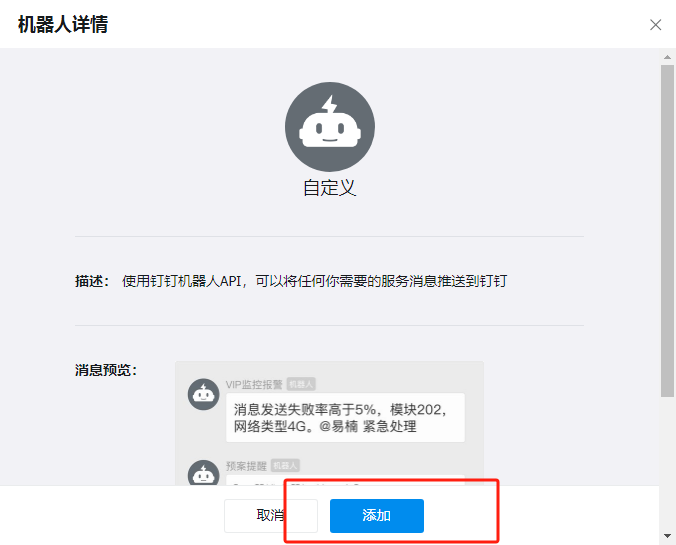
步骤三、设置自定义

步骤四、
步骤五、设置加签 并复制
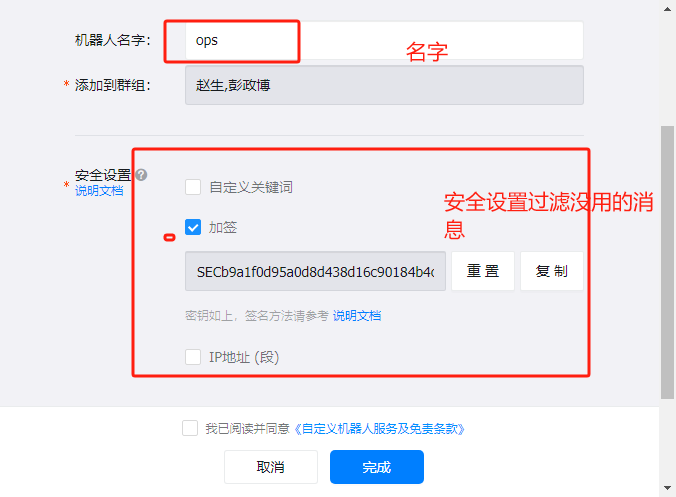
步骤六、
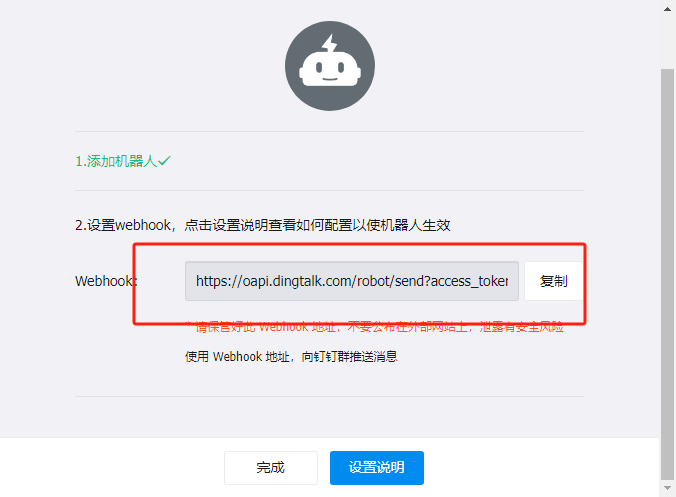
这时我们就看到钉钉添加机器人成功了

5.5、在webhook配置文件当中添加webhook1
vim /data/prometheus-webhook-dingtalk-2.1.0.linux-amd64/config.example.yml## Request timeout# timeout: 5s## Uncomment following line in order to write template from scratch (be careful!)#no_builtin_template: true## Customizable templates path#templates:# - contrib/templates/legacy/template.tmpl## Targets, previously was known as \"profiles\"targets: webhook1:#步骤六的机器人地址 url: https://oapi.dingtalk.com/robot/send?access_token=62638c23119337210244fa5c33b5d0dd5a5df105b3d802538df09e33c45333d5 # secret for signature步骤五的安全设置的加密 secret: SEC35f4c12c1997a68be9230c1cdc07bb6100fc8f456a685ba29b0039adaf445734 webhook2: url: https://oapi.dingtalk.com/robot/send?access_token=xxxxxxxxxxxx webhook_legacy: url: https://oapi.dingtalk.com/robot/send?access_token=xxxxxxxxxxxx # Customize template content message: # Use legacy template title: \'{{ template \"legacy.title\" . }}\' text: \'{{ template \"legacy.content\" . }}\' webhook_mention_all: url: https://oapi.dingtalk.com/robot/send?access_token=xxxxxxxxxxxx mention: all: true webhook_mention_users: url: https://oapi.dingtalk.com/robot/send?access_token=xxxxxxxxxxxx mention: mobiles: [\'156xxxx8827\', \'189xxxx8325\']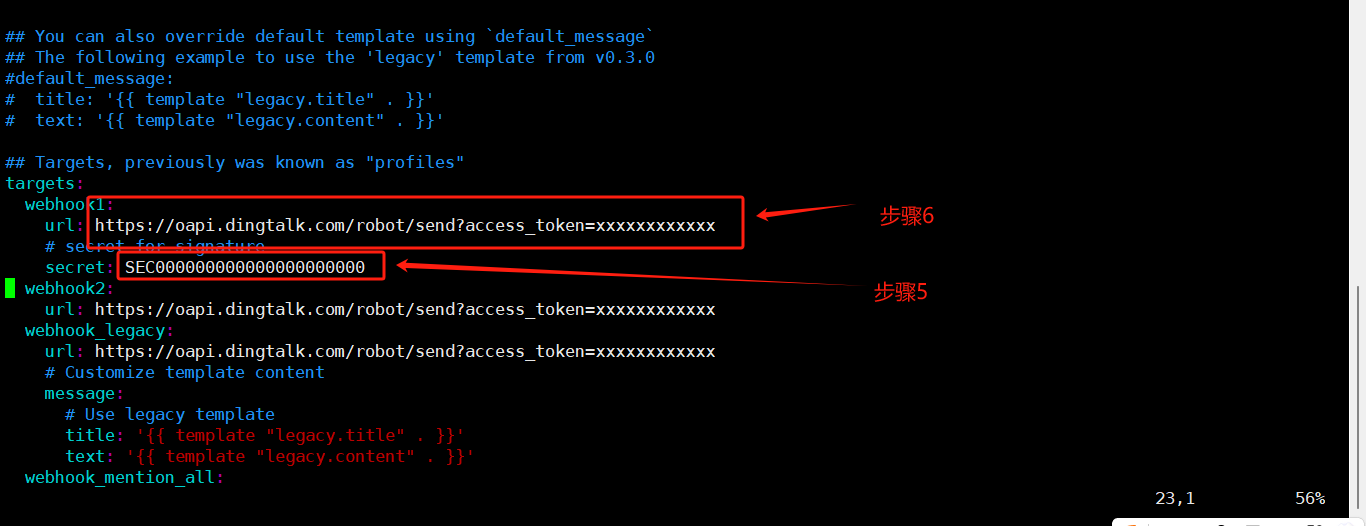
4.5、配置钉钉模版
vim /data/prometheus-webhook-dingtalk-2.1.0.linux-amd64/template.tmpl/template.tmpl{{ define \"__subject\" }}[{{ .Status | toUpper }}{{ if eq .Status \"firing\" }}:{{ .Alerts.Firing | len }}{{ end }}]{{ end }} {{ define \"__alert_list\" }}{{ range . }}---{{ if .Labels.owner }}@{{ .Labels.owner }}{{ end }} **告警主题**: {{ .Annotations.summary }}**告警类型**: {{ .Labels.alertname }} **告警级别**: {{ .Labels.severity }} **告警主机**: {{ .Labels.instance }} **告警信息**: {{ index .Annotations \"description\" }} **告警时间**: {{ dateInZone \"2006.01.02 15:04:05\" (.StartsAt) \"Asia/Shanghai\" }}{{ end }}{{ end }} {{ define \"__resolved_list\" }}{{ range . }}---{{ if .Labels.owner }}@{{ .Labels.owner }}{{ end }}**告警主题**: {{ .Annotations.summary }}**告警类型**: {{ .Labels.alertname }} **告警级别**: {{ .Labels.severity }} **告警主机**: {{ .Labels.instance }} **告警信息**: {{ index .Annotations \"description\" }} **告警时间**: {{ dateInZone \"2006.01.02 15:04:05\" (.StartsAt) \"Asia/Shanghai\" }} **恢复时间**: {{ dateInZone \"2006.01.02 15:04:05\" (.EndsAt) \"Asia/Shanghai\" }}{{ end }}{{ end }} {{ define \"default.title\" }}{{ template \"__subject\" . }}{{ end }} {{ define \"default.content\" }}{{ if gt (len .Alerts.Firing) 0 }}**====侦测到{{ .Alerts.Firing | len }}个故障====**{{ template \"__alert_list\" .Alerts.Firing }}---{{ end }} {{ if gt (len .Alerts.Resolved) 0 }}**====恢复{{ .Alerts.Resolved | len }}个故障====**{{ template \"__resolved_list\" .Alerts.Resolved }}{{ end }}{{ end }} {{ define \"ding.link.title\" }}{{ template \"default.title\" . }}{{ end }}{{ define \"ding.link.content\" }}{{ template \"default.content\" . }}{{ end }}{{ template \"default.title\" . }}{{ template \"default.content\" . }}vim /data/prometheus-webhook-dingtalk-2.1.0.linux-amd64/config.example.yml ## Request timeout# timeout: 5s## Uncomment following line in order to write template from scratch (be careful!)#no_builtin_template: true## Customizable templates path#删掉注释模版文件templates: - contrib/templates/legacy/template.tmpl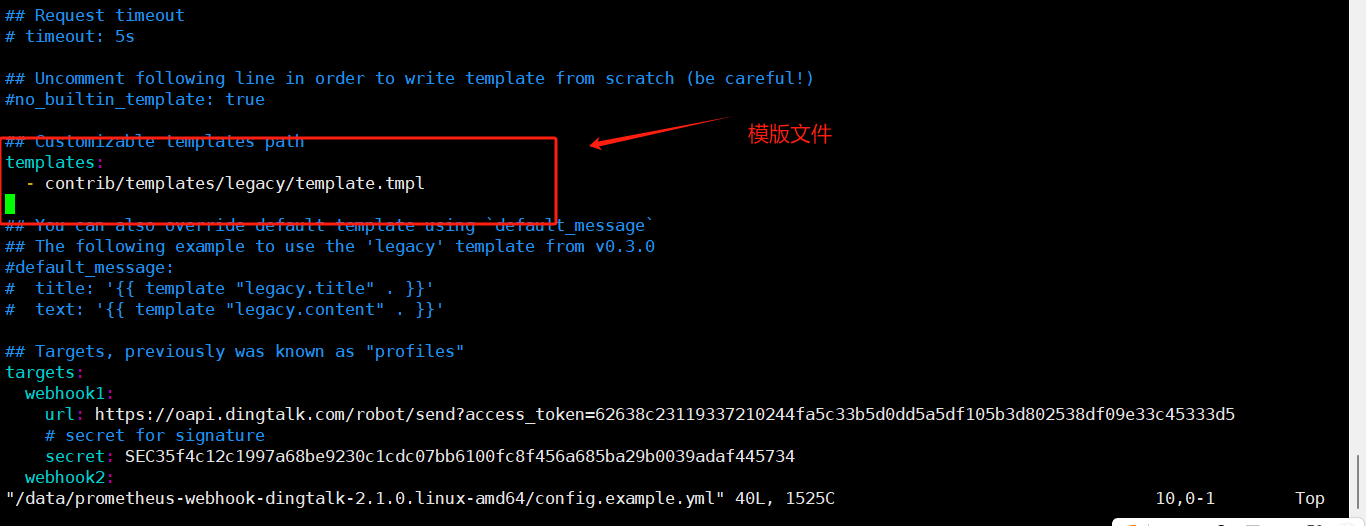
5.6、配置alertmanager配置文件
route:#分组聚合减少告警消息数量 group_by: [\'alertname\']#告警时,先收集报警然后在发送 group_wait: 30s #当收到告警时,先等待30秒在一起发送 group_interval: 5m #发送警告时间间隔 repeat_interval: 1h #重复报警时间间隔 receiver: \'dingding.webhook1\'receivers: - name: \'dingdingwebhook1\' webhook_configs: - url: \'\'http://172.16.254.190:8060/dingtalk/webhook1/send\'inhibit_rules: - source_match: severity: \'critical\' target_match: severity: \'warning\' equal: [\'alertname\', \'dev\', \'instance\']5.7、重启webhook和alertmanager服务
systemctl restart webhooksystemctl restart alertmanager6、查看是否能触发报警
6.1、登录node1服务器关闭node_exporte服务
systemctl restart alertmanager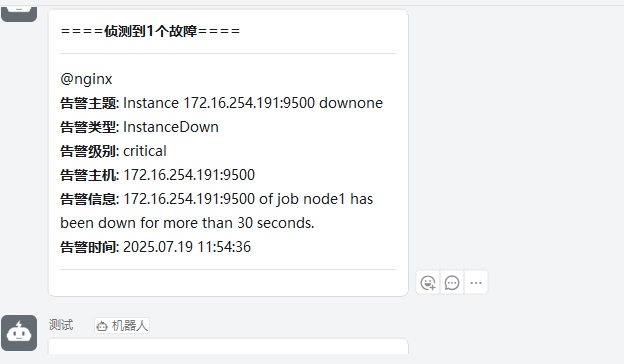
三、生产环境场景
Nginx监控
nginx-module-vts:Nginx virtual host traffic status module,Nginx的监控模块,能够提供JSON格式的数据产出。
nginx-vts-exporter:Simple server that scrapes Nginx vts stats and exports them via HTTP for Prometheus consumption。主要用于收集Nginx的监控数据,并给Prometheus提供监控接口,默认端口号9913。
Prometheus:监控Nginx-vts-exporter提供的Nginx数据,并存储在时序数据库中,可以使用PromQL对时序数据进行查询和聚合。
Nginx安装
前期准备
1、Nginx源码获取
#创建源码包文件mkdir /data/sourcewget https://nginx.org/download/nginx-1.28.0.tar.gz tar -xf nginx-1.28.0.tar.gz -C /data/source/2、安装编译工具及依赖库,脚本如下:
yum -y install gcc pcre-devel zlib-devel openssl-devel libxml2-devel \\ libxslt-devel gd-devel GeoIP-devel jemalloc-devel libatomic_ops-devel \\ perl-devel perl-ExtUtils-Embed3、编译配置参数配置
4、编译
cd /data/source/./configure \\ --with-threads \\ --with-file-aio \\ --with-http_ssl_module \\ --with-http_v2_module \\ --with-http_realip_module \\ --with-http_addition_module \\ --with-http_xslt_module=dynamic \\ --with-http_image_filter_module=dynamic \\ --with-http_geoip_module=dynamic \\ --with-http_sub_module \\ --with-http_dav_module \\ --with-http_flv_module \\ --with-http_mp4_module \\ --with-http_gunzip_module \\ --with-http_gzip_static_module \\ --with-http_auth_request_module \\ --with-http_random_index_module \\ --with-http_secure_link_module \\ --with-http_degradation_module \\ --with-http_slice_module \\ --with-http_stub_status_module \\ --with-stream=dynamic \\ --with-stream_ssl_module \\ --with-stream_realip_module \\ --with-stream_geoip_module=dynamic \\ --with-stream_ssl_preread_module \\ --with-compat \\ --with-pcre-jitmake && make install编译后,默认安装目录为 /usr/local/nginx。
5、添加第三方模块
5.1、查看都安装了哪些模块
/usr/local/nginx/sbin/nginx -Vnginx version: nginx/1.28.0built by gcc 4.8.5 20150623 (Red Hat 4.8.5-44) (GCC) built with OpenSSL 1.0.2k-fips 26 Jan 2017TLS SNI support enabledconfigure arguments: --with-threads --with-file-aio --with-http_ssl_module --with-http_v2_module --with-http_realip_module --with-http_addition_module --with-http_xslt_module=dynamic --with-http_image_filter_module=dynamic --with-http_geoip_module=dynamic --with-http_sub_module --with-http_dav_module --with-http_flv_module --with-http_mp4_module --with-http_gunzip_module --with-http_gzip_static_module --with-http_auth_request_module --with-http_random_index_module --with-http_secure_link_module --with-http_degradation_module --with-http_slice_module --with-http_stub_status_module --with-stream=dynamic --with-stream_ssl_module --with-stream_realip_module --with-stream_geoip_module=dynamic --with-stream_ssl_preread_module --with-compat --with-pcre-jit5.2、下载第三方模块
5.3、添加到nginx
#复制原先模块后添加第三方模块cd /data/source/nginx-1.28.0/./configure --with-threads --with-file-aio --with-http_ssl_module --with-http_v2_module --with-http_realip_module --with-http_addition_module --with-http_xslt_module=dynamic --with-http_image_filter_module=dynamic --with-http_geoip_module=dynamic --with-http_sub_module --with-http_dav_module --with-http_flv_module --with-http_mp4_module --with-http_gunzip_module --with-http_gzip_static_module --with-http_auth_request_module --with-http_random_index_module --with-http_secure_link_module --with-http_degradation_module --with-http_slice_module --with-http_stub_status_module --with-stream=dynamic --with-stream_ssl_module --with-stream_realip_module --with-stream_geoip_module=dynamic --with-stream_ssl_preread_module --with-compat --with-pcre-jit --with-http_ssl_module --add-module=/usr/local/nginx-module-vts-0.2.4make切记不要make install 会覆盖之前的模块。
5.4、替换二进制文件
#这里复制一下原来的文件,出了问题还可以还原mv /usr/local/nginx/sbin/nginx /usr/local/nginx/sbin/nginx.bak复制这个文件复制过去 cp /data/source/nginx-1.28.0/objs/nginx /usr/local/nginx/sbin/pkill -9 nginx ## 关闭nginx#启动nginx/usr/local/nginx/sbin/nginx .5.5、修改nginx.conf配置,实验安装是否成功:
http { ... vhost_traffic_status_zone; vhost_traffic_status_filter_by_host on; ... server { ... location /status { vhost_traffic_status_display; vhost_traffic_status_display_format html; }}配置解析:
打开vhost过滤:
vhost_traffic_status_filter_by_host on;
开启此功能,在Nginx配置有多个server_name的情况下,会根据不同的server_name进行流量的统计,否则默认会把流量全部计算到第一个server_name上。
在不想统计流量的server区域禁用vhost_traffic_status,配置示例
server {...vhost_traffic_status off;...}5.6、启动服务
/usr/local/nginx/sbin/nginx打开浏览器访问ip/status:
5.7、安装nginx-vts-exporter
wget https://github.com/hnlq715/nginx-vts-exporter/bin/nginx-vts-exporter -nginx.scrape_uri=http://172.16.254.191/status/format/jsongrafana
导入2949模板
四、node_export 自定义监控指标
Prometheus 的 node_exporter 是一个非常流行的导出器,用于收集系统级别的指标。然而,有时你可能需要监控一些自定义的指标。以下是如何配置 node_exporter 来监控自定义指标的步骤。
1、自定义监控nginx服务存活性
例如,创建一个名为 custom_metrics.sh 的 Bash 脚本
#!/bin/bashecho \"# HELP custom_metric_example This is an example of a custom metric\"echo \"# TYPE custom_metric_example gauge\"echo \"nginx up \"服务监控脚本
#!/bin/bashps -ef|grep nginx|grep -v grep > /dev/nullif [ $? -eq 0 ];thenecho \"# HELP custom_metric_example This is an example of a custom metric\"echo \"# TYPE custom_metric_example gauge\"echo \"nginx_up 1\"elseecho \"# HELP custom_metric_example This is an example of a custom metric\"echo \"# TYPE custom_metric_example gauge\"echo \"nginx_up 0\"2. 配置 node_exporter 以执行自定义脚本
node_exporter 支持通过 textfile 模式来导入自定义指标。你需要将自定义脚本的输出写入到一个特定的目录中,node_exporter 会定期读取这个目录中的文件并将其内容作为指标导入。
创建一个目录来存放自定义指标文件:
mkdir -p/data/node_exporter-1.8.2.linux-amd64/textfile_collectorsh custom_metrics.sh > //data/node_exporter-1.8.2.linux/amd64/textfile_collector/custom_metrics.prom3、添加到systemctl服务
cat/usr/lib/systemd/system/node_exporter.service [Unit]Description=Prometheus-ServerAfter=network.target[Service]ExecStart=/data/node_exporter-1.8.2.linux-amd64/node_exporter --collector.textfile.directory=/data/node_exporter-1.8.2.linux-amd64/textfile_collector --web.listen-address=:9500User=root[Install]WantedBy=multi-user.target4、启动服务
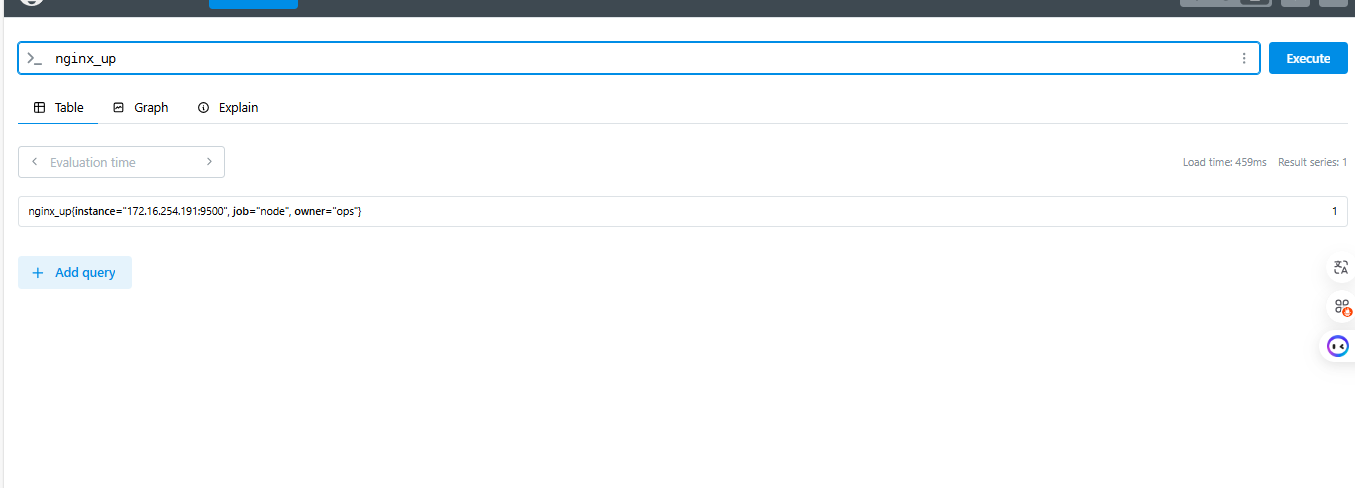
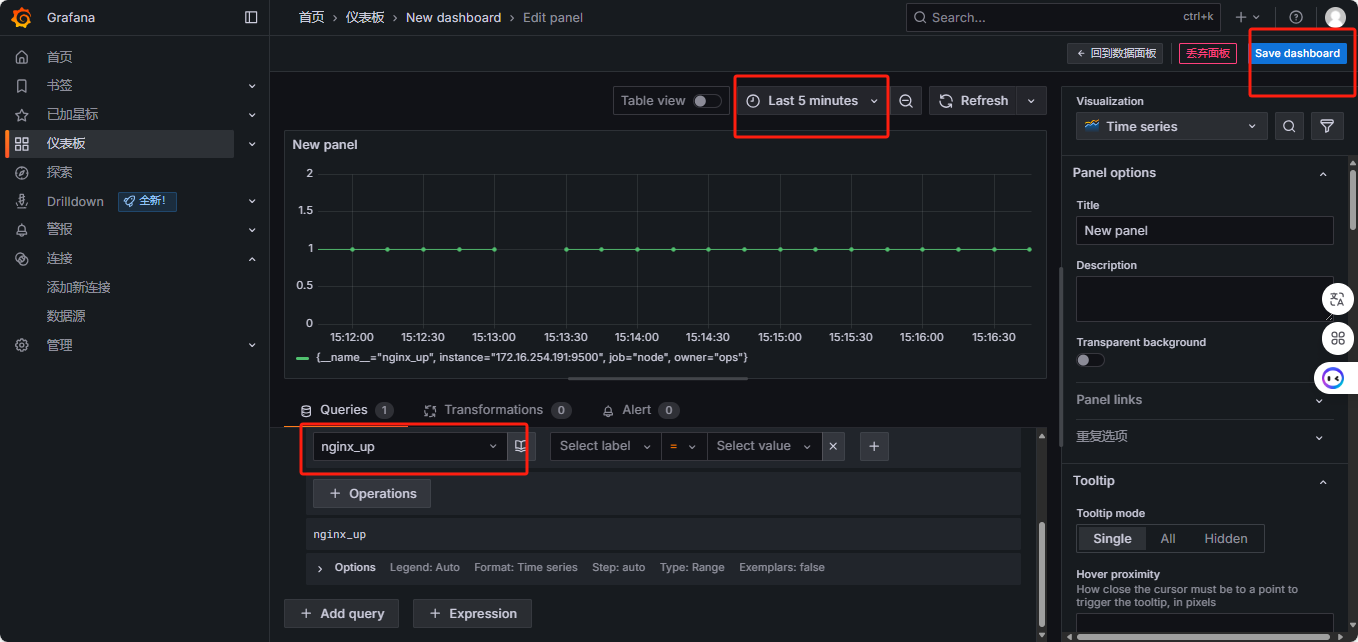
systemctl restart node_exporter #curl 请求一下看是否有数据[root@node1 node_exporter-1.8.2.linux-amd64]# curl 172.16.254.191:9500/metrics |grep nginx % Total % Received % Xferd Average Speed Time Time Time Current Dload Upload Total Spent Left Speed 0 0 0 0 0 0 0 0 --:--:-- --:--:-- --:--:-- 0# HELP nginx_up Metric read from /data/node_exporter-1.8.2.linux-amd64/textfile_collector/custom_metrics.prom# TYPE nginx_up untypednginx_up 1100 76559 0 76559 0 0 4662k 0 --:--:-- --:--:-- --:--:-- 4984k5、浏览器访问Prometheus是否有数据
ip:端口号
6、配置自定义grafana
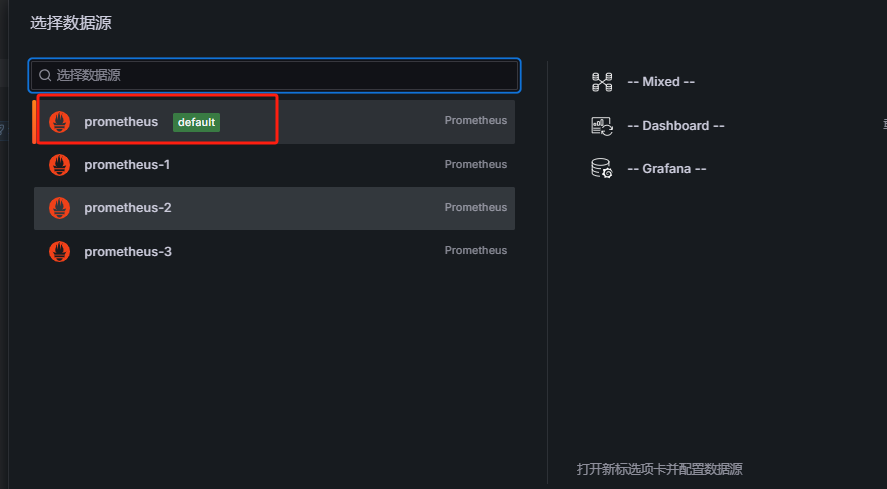
借鉴大佬文章:
Prometheus+Alertmanager+webhook-dingtalk实现钉钉告警 - 不会游泳的鱼丶 - 博客园
(6 封私信) https://webhook.site/ - 知乎

