计算机视觉-局部图像描述子
[原发布时间: 2022-03-24 21:59:29]
目录
-
- 1. 相关概念
-
- 1.1 角点及其类型
- 1.2 角点的性质
- 1.3 Harris角点检测
- 2. 理论基础
-
- 2.1 Harris角点检测数学模型
- 2.2 角点响应函数
- 3. 代码实现
-
- 3.1 使用Harris检测器检测角点
- 3.2 为每个角点添加描述子
- 3.3 SIFT算法
- 3.4 描述子匹配
- 3.5 匹配地理标记图像
1. 相关概念
1.1 角点及其类型
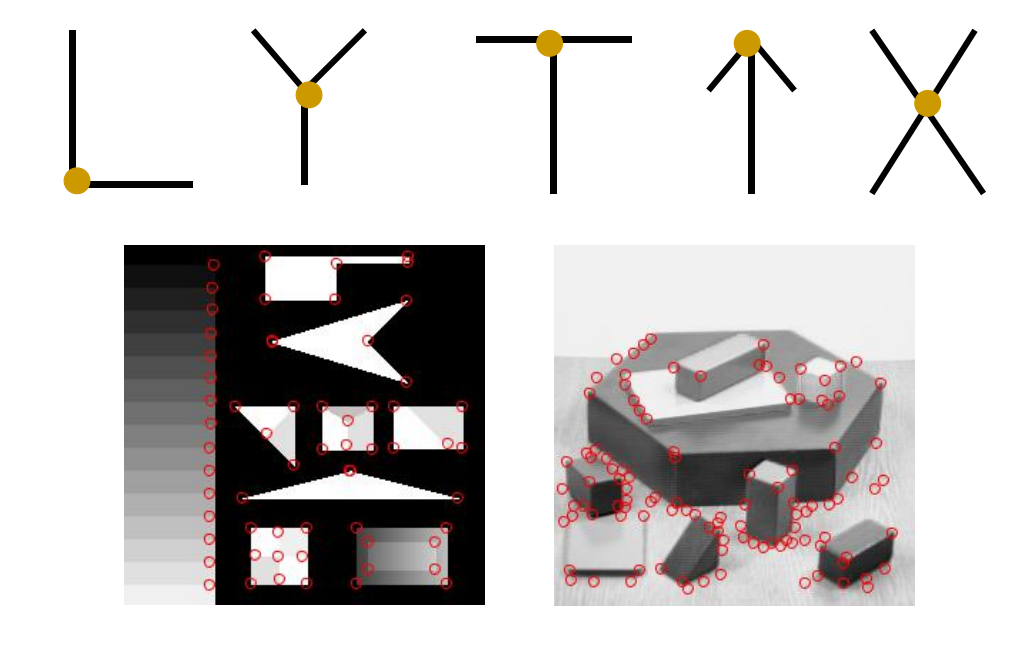
角点:角点通常被定义为两条边的交点,严格说角点的局部邻域应该具有两个不同区域的不同方向的边界。角点检测(Corner Detection)是计算机视觉系统中获取图像特征的一种方法,广泛应用于运动检测、图像匹配、视频跟踪、三维重建和目标识别等,也可称为特征点检测。
角点的类型:
1.2 角点的性质
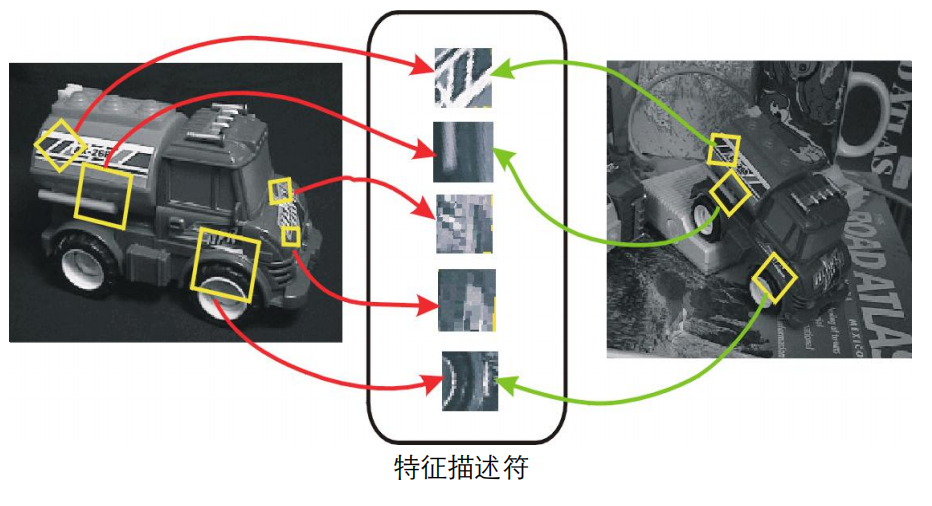
如上是同一物体在不同角度、明暗程度下的图片,但通过角点可以将两张图片进行特征匹配,因此需要求角点需具备以下基本性质:
- 几何不变性:位移、旋转、尺度……
- 光度不变性:光照、 曝光……
1.3 Harris角点检测
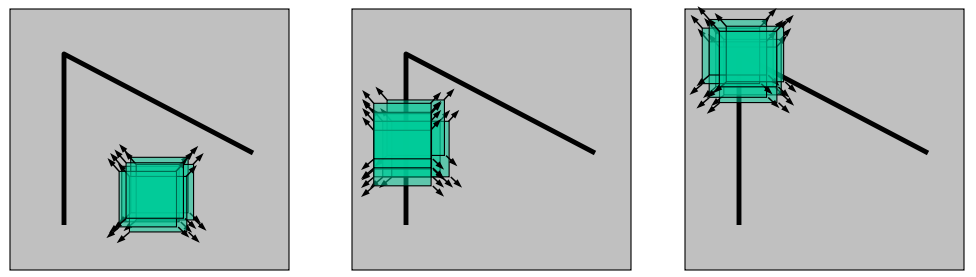
基本思想:使用一个固定窗口在图像上进行任意方向上的滑动,比较滑动前与滑动后窗口中的像素灰度变化程度。如果存在任意方向上的滑动,都有着较大灰度变化,那么我们可以认为该窗口中存在角点。
过程:
当一个窗口在图像上移动时,如图 (a) (a) (a),窗口在各个方向上都没有变化,则认为窗口区域为平滑区域。如图 (b) (b) (b),窗口在某个方向上没有变化,另一个方向上有明显变化,那么,这块区域可能存在边缘。如图 (c) (c) (c),窗口在各个方向上灰度发生了较大的变化,那么,这块区域可能存在角点。Harris角点检测正是利用了这个直观的物理现象,通过窗口在各个方向上的变化程度来决定角点。
2. 理论基础
2.1 Harris角点检测数学模型
图像窗口平移[u,v]后产生的灰度变化E(u,v)可表示为
E ( u , v ) = ∑ x , y w ( x , y ) [ I ( x + u , y + v ) − I ( x , y ) ] 2 E(u,v)=\\displaystyle\\sum_{x,y}w(x,y)[I(x+u,y+v)-I(x,y)]^2 E(u,v)=x,y∑w(x,y)[I(x+u,y+v)−I(x,y)]2
其中, w(x,y) w(x,y) w(x,y)为窗口函数,常见的窗口函数如下:
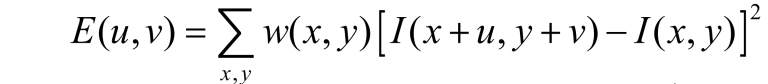
I(x+u,y+v) I(x+u,y+v) I(x+u,y+v)为平移后的图像灰度, I(x,y) I(x,y) I(x,y)为图像在(x,y)点的灰度。为了寻找带角点的窗口,需要搜索像素灰度变化较大的窗口。于是,我们期望最大化 E(u,v) E(u,v) E(u,v)。
假设u和v很小,则有:
I ( x + u , y + v ) − I ( x , y ) ≈ I x u + I y v I(x+u,y+v)-I(x,y)\\approx I_xu+I_yv I(x+u,y+v)−I(x,y)≈Ixu+Iyv
于是对于局部微小的移动量[u,v],可以近似得到下面的表达式
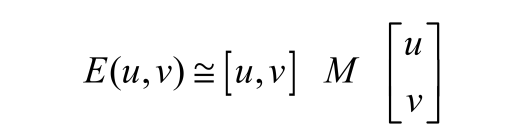
其中M是2x2矩阵,可由图像的导数求得
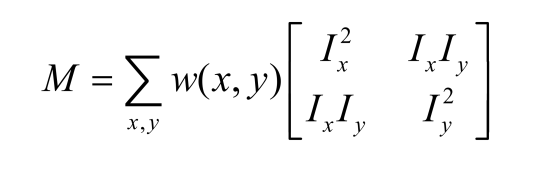
协方差矩阵可以表示多维随机变量之间的相关性。协方差矩阵的对角线元素表示的是各个维度的方差,而非对角线上的元素表示的是各个维度之间的相关性。可以把矩阵M看作一个二维随机分布的协方差矩阵,通过将其对角化,求矩阵的两个特征值,然后根据这两个特征值来判断是不是角点。
假设λ1,λ2为矩阵M的特征值,当λ1≫λ2或λ1≪λ2时,该区域为边缘点;当λ1和λ2都很小且接近时,该区域为平坦区域内的点;当λ1和λ2都很大且接近时,说明图像窗口在各个方向上移动都产生了明显灰度变化,此时该区域为角点。
2.2 角点响应函数
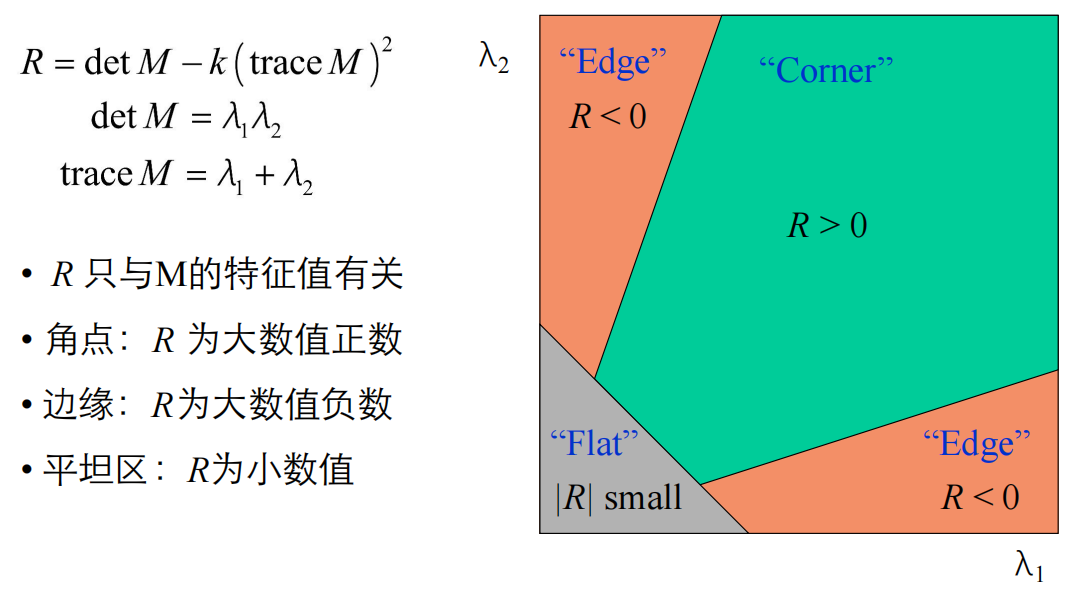
由于特征值的计算量较大,因此,实际中采用角点响应函数来检测角点。角点响应函数定义为
R = D e t ( M ) − k [ t r a c e ( M ) ] 2 = λ 1λ 2 − k ( λ 1 + λ 2) 2 ( k = 0.04 ∽ 0.06 ) R=Det(M)-k[trace(M)]^2=\\lambda_1\\lambda_2-k(\\lambda_1+\\lambda_2)^2 \\\\ (k=0.04\\backsim 0.06) R=Det(M)−k[trace(M)]2=λ1λ2−k(λ1+λ2)2(k=0.04∽0.06)
其中R的值只与M的特征值有关,R的值与区域类型的关系如下:
3. 代码实现
3.1 使用Harris检测器检测角点
源码:
from pylab import *from PIL import Imagefrom PCV.localdescriptors import harris# 添加中文字体支持from matplotlib.font_manager import FontPropertiesfont = FontProperties(fname=r\"c:\\windows\\fonts\\SimSun.ttc\", size=14)# 读入图像im = array(Image.open(\'C:/Users/lenovo/Pictures/Saved Pictures/view1.jpg\').convert(\'L\'))# 检测harris角点harrisim = harris.compute_harris_response(im)# Harris响应函数harrisim1 = 255 - harrisimfigure()gray()#画出Harris响应图subplot(141)imshow(harrisim1)title(u\'(1)\', fontproperties=font)print(harrisim1.shape)axis(\'off\')threshold = [0.01, 0.05, 0.1]for i, thres in enumerate(threshold): filtered_coords = harris.get_harris_points(harrisim, 6, thres) subplot(1, 4, i+2) imshow(im) title(u\'(\'+str(i+2)+\')\', fontproperties=font) print(im.shape) plot([p[1] for p in filtered_coords], [p[0] for p in filtered_coords], \'*\') axis(\'off\')show()运行结果:
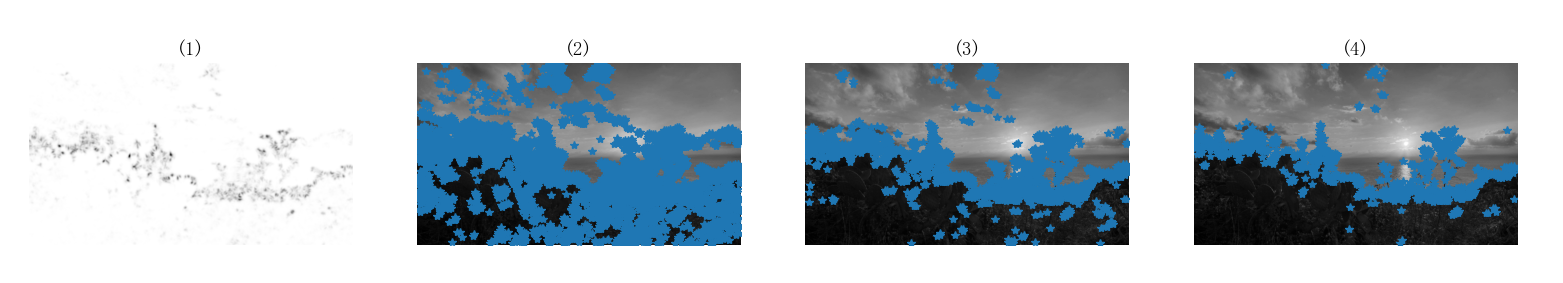
其中,图(1)为画出Harris响应图,图(2-4)分别是使用阈值为0.01、0.05和0.1检测出的角点。
3.2 为每个角点添加描述子
源码:
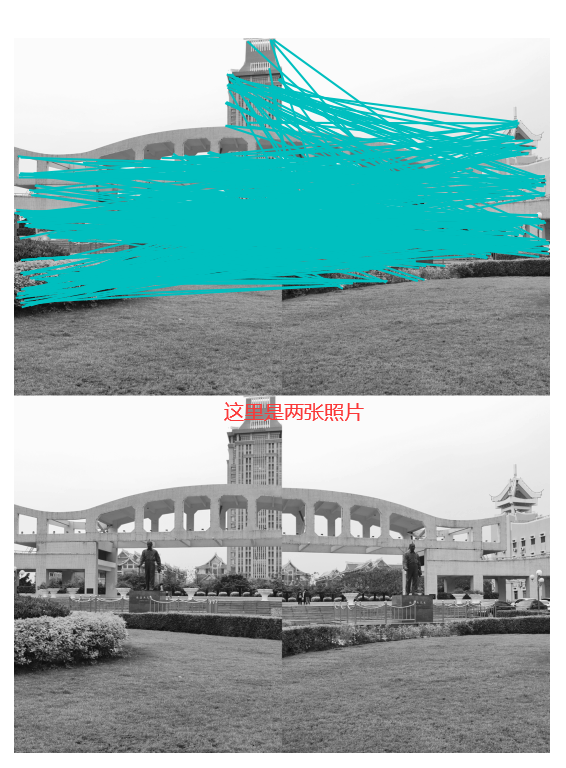
from pylab import *from PIL import Imagefrom PCV.localdescriptors import harrisfrom PCV.tools.imtools import imresizeim1 = array(Image.open(\"C:/Users/lenovo/Pictures/Saved Pictures/view1.jpg\").convert(\"L\"))im2 = array(Image.open(\"C:/Users/lenovo/Pictures/Saved Pictures/view2.jpg\").convert(\"L\"))# resize加快匹配速度im1 = imresize(im1, (im1.shape[1]/2, im1.shape[0]/2))im2 = imresize(im2, (im2.shape[1]/2, im2.shape[0]/2))wid = 5harrisim = harris.compute_harris_response(im1, 5)filtered_coords1 = harris.get_harris_points(harrisim, wid+1)d1 = harris.get_descriptors(im1, filtered_coords1, wid)harrisim = harris.compute_harris_response(im2, 5)filtered_coords2 = harris.get_harris_points(harrisim, wid+1)d2 = harris.get_descriptors(im2, filtered_coords2, wid)print(\'starting matching\')matches = harris.match_twosided(d1, d2)figure()gray() harris.plot_matches(im1, im2, filtered_coords1, filtered_coords2, matches)show()运行结果:
3.3 SIFT算法
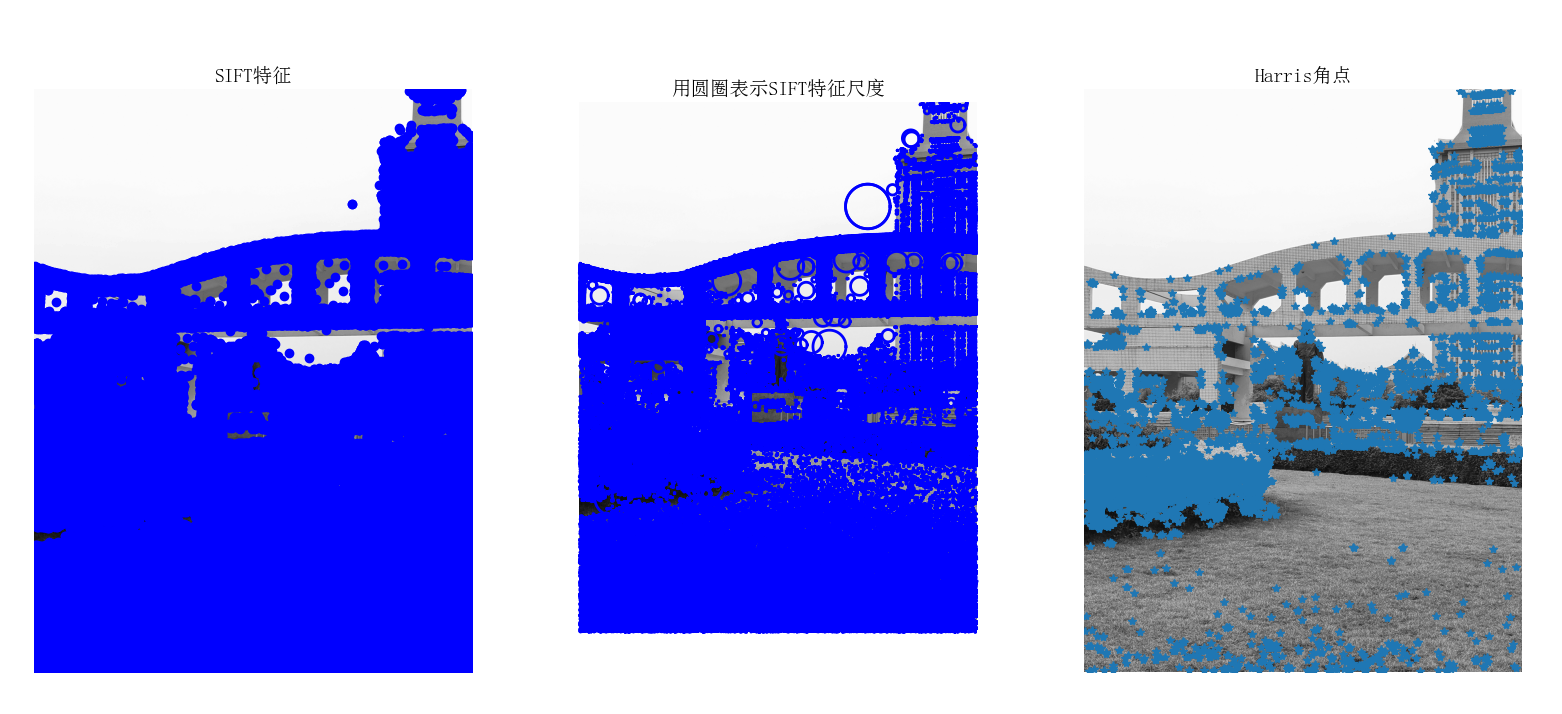
由于Harris角点检测器是旋转不变的,这意味着即使图像旋转了,检测器也可以找到相同的角,这是因为转角在旋转的图像中也仍然是转角。但是在缩放的情况下拐角可能不是拐角。例如,使用检测器检查下面的简单图像,在同一窗口中放大小窗口图像中的拐角时,该角可认为是平坦的,即Harris拐角不是尺度不变的。因此,在2004年,不列颠哥伦比亚大学的D.Lowe在他的论文《尺度不变关键点中的独特图像特征》中提出了一种新算法,即尺度不变特征变换(SIFT)算法,该算法提取关键点并计算其描述算符,并且SIFT算法能够适应旋转、尺度缩放、亮度的变化,也能在一定程度上不受视角变化、仿射变换、噪声的干扰。
下面使用SIFT算法对图像提取SIFT特征,并与提取的Harri角点进行比较。
源码:
from PIL import Imagefrom pylab import *from PCV.localdescriptors import siftfrom PCV.localdescriptors import harris# 添加中文字体支持from matplotlib.font_manager import FontPropertiesfont = FontProperties(fname=r\"c:\\windows\\fonts\\SimSun.ttc\", size=14)imname = \'C:/Users/lenovo/Pictures/Saved Pictures/view1.jpg\'im = array(Image.open(imname).convert(\'L\'))sift.process_image(imname, \'empire.sift\')l1, d1 = sift.read_features_from_file(\'empire.sift\')figure()gray()subplot(131)sift.plot_features(im, l1, circle=False)title(u\'SIFT特征\',fontproperties=font)subplot(132)sift.plot_features(im, l1, circle=True)title(u\'用圆圈表示SIFT特征尺度\',fontproperties=font)# 检测harris角点harrisim = harris.compute_harris_response(im)subplot(133)filtered_coords = harris.get_harris_points(harrisim, 6, 0.1)imshow(im)plot([p[1] for p in filtered_coords], [p[0] for p in filtered_coords], \'*\')axis(\'off\')title(u\'Harris角点\',fontproperties=font)show()运行结果:
(注:运行代码时报“empire.sift not found”错误时的解决方法)
3.4 描述子匹配
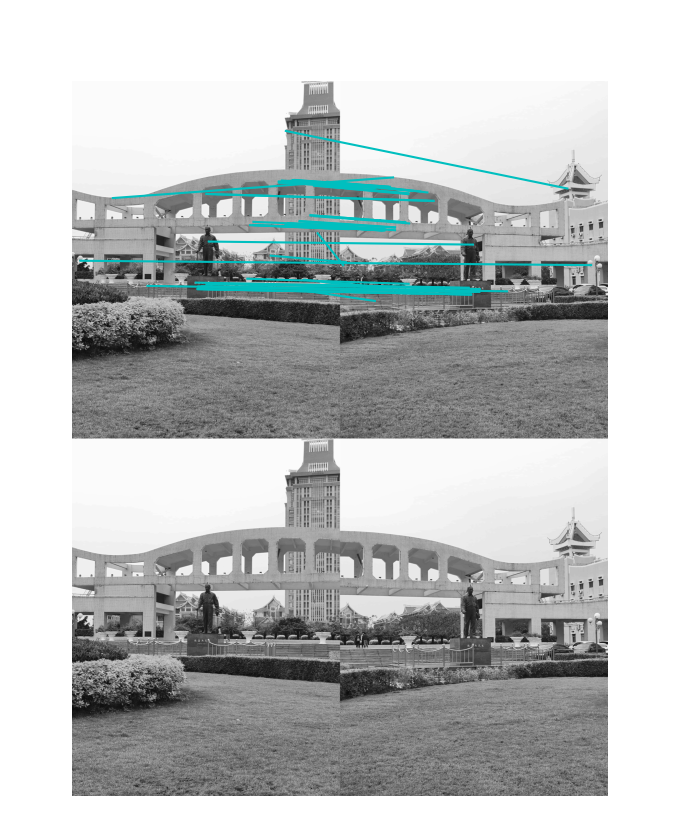
from PIL import Imagefrom pylab import *from PCV.localdescriptors import siftim1f = \'C:/Users/lenovo/Pictures/Saved Pictures/view3.jpg\'im2f = \'C:/Users/lenovo/Pictures/Saved Pictures/view4.jpg\'im1 = array(Image.open(im1f).convert(\'L\'))im2 = array(Image.open(im2f).convert(\'L\'))sift.process_image(im1f, \'out_sift_1.txt\')l1, d1 = sift.read_features_from_file(\'out_sift_1.txt\')figure()gray()subplot(121)sift.plot_features(im1, l1, circle=False)sift.process_image(im2f, \'out_sift_2.txt\')l2, d2 = sift.read_features_from_file(\'out_sift_2.txt\')subplot(122)sift.plot_features(im2, l2, circle=False)matches = sift.match_twosided(d1, d2)print (\'{} matches\'.format(len(matches.nonzero()[0])))figure()gray()sift.plot_matches(im1, im2, l1, l2, matches, show_below=True)show()运行结果:

3.5 匹配地理标记图像
源码:
from pylab import *from PIL import Imagefrom PCV.localdescriptors import siftfrom PCV.tools import imtoolsimport pydotdownload_path = \"D:/image/\" # set this to the path where you downloaded the panoramio imagespath = \"D:/image/\" # path to save thumbnails (pydot needs the full system path)imlist = imtools.get_imlist(download_path)nbr_images = len(imlist)featlist = [imname[:-3] + \'sift\' for imname in imlist]for i, imname in enumerate(imlist): sift.process_image(imname, featlist[i])matchscores = zeros((nbr_images, nbr_images))for i in range(nbr_images): for j in range(i, nbr_images): # only compute upper triangle print(\'comparing \', imlist[i], imlist[j]) l1, d1 = sift.read_features_from_file(featlist[i]) l2, d2 = sift.read_features_from_file(featlist[j]) matches = sift.match_twosided(d1, d2) nbr_matches = sum(matches > 0) print(\'number of matches = \', nbr_matches) matchscores[i, j] = nbr_matchesprint(\"The match scores is: \\n\", matchscores)for i in range(nbr_images): for j in range(i + 1, nbr_images): # no need to copy diagonal matchscores[j, i] = matchscores[i, j]#可视化threshold = 2 # min number of matches needed to create linkg = pydot.Dot(graph_type=\'graph\') # don\'t want the default directed graphfor i in range(nbr_images): for j in range(i + 1, nbr_images): if matchscores[i, j] > threshold: # first image in pair im = Image.open(imlist[i]) im.thumbnail((100, 100)) filename = path + str(i) + \'.png\' im.save(filename) # need temporary files of the right size g.add_node(pydot.Node(str(i), fontcolor=\'transparent\', shape=\'rectangle\', image=filename)) # second image in pair im = Image.open(imlist[j]) im.thumbnail((100, 100)) filename = path + str(j) + \'.png\' im.save(filename) # need temporary files of the right size g.add_node(pydot.Node(str(j), fontcolor=\'transparent\', shape=\'rectangle\', image=filename)) g.add_edge(pydot.Edge(str(i), str(j)))g.write_png(\'jmu.png\')由于运行该代码需要消耗足够大的算力,耗时一整天仍未出结果后暂时放弃运行,因此暂无图像集匹配连线后的结果( •̀ ω •́ )✧。

