【无标题】prometheus集成Springboot
Springboot+prometheus+grafana 集成
Springboot
引入POM
<dependency> <groupId>io.micrometer</groupId> <artifactId>micrometer-registry-prometheus</artifactId></dependency><!-- Spring Boot 2.x --><dependency> <groupId>org.springframework.boot</groupId> <artifactId>spring-boot-starter-actuator</artifactId></dependency>配置application.yml
management: endpoints: web: exposure: include: health,info,prometheus endpoint: prometheus: enabled: true metrics: export: prometheus: enabled: true server: port: 8080启动 Spring Boot 项目,访问指标
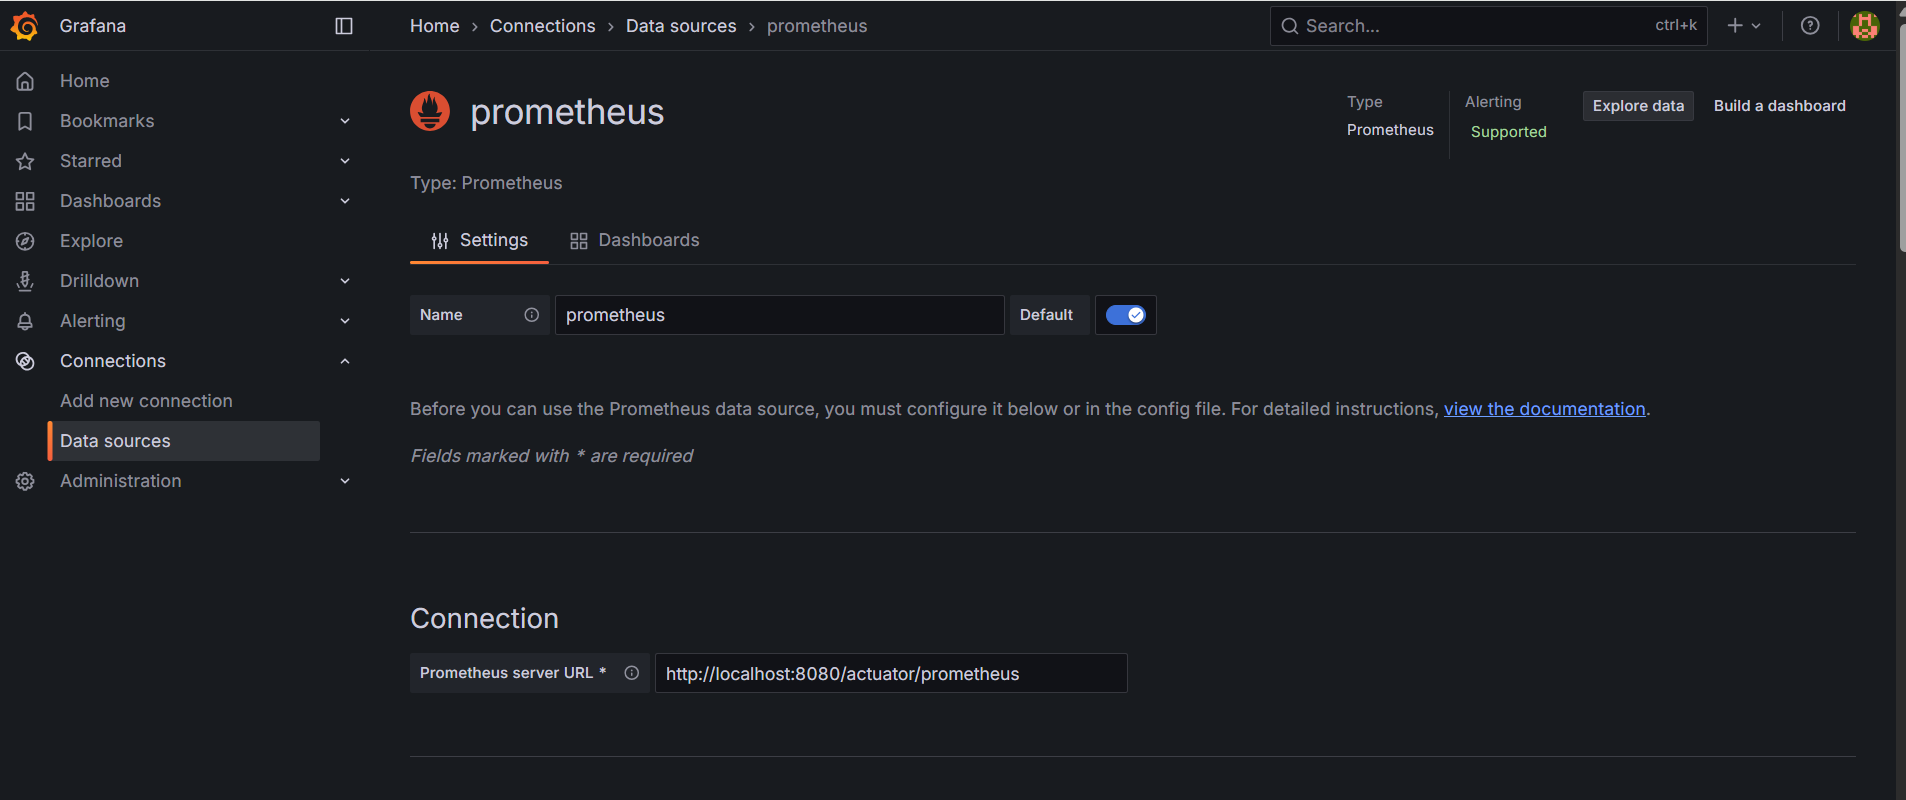
http://localhost:8080/actuator/prometheus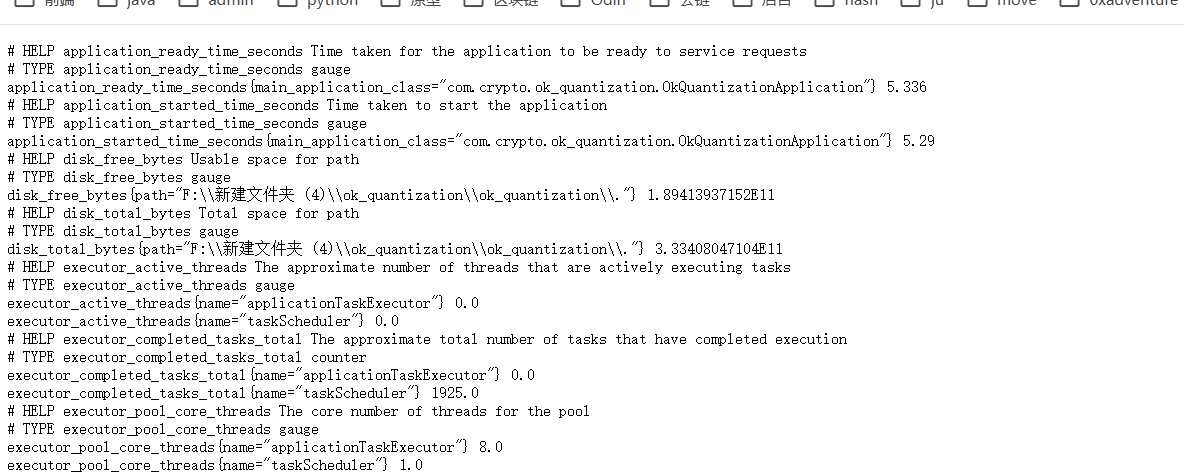
Prometheus 配置采集 Spring Boot 指标
scrape_configs: - job_name: \'spring-boot-app\' metrics_path: \'/actuator/prometheus\' static_configs: - targets: [\'localhost:8080\']定义业务耗时指标
@Autowiredprivate MeterRegistry meterRegistry;public void processData() { Timer timer = meterRegistry.timer(\"my_custom_process_time\"); timer.record(() -> { // 你要计时的代码 someLogic(); });}prometheus
https://prometheus.io/download/
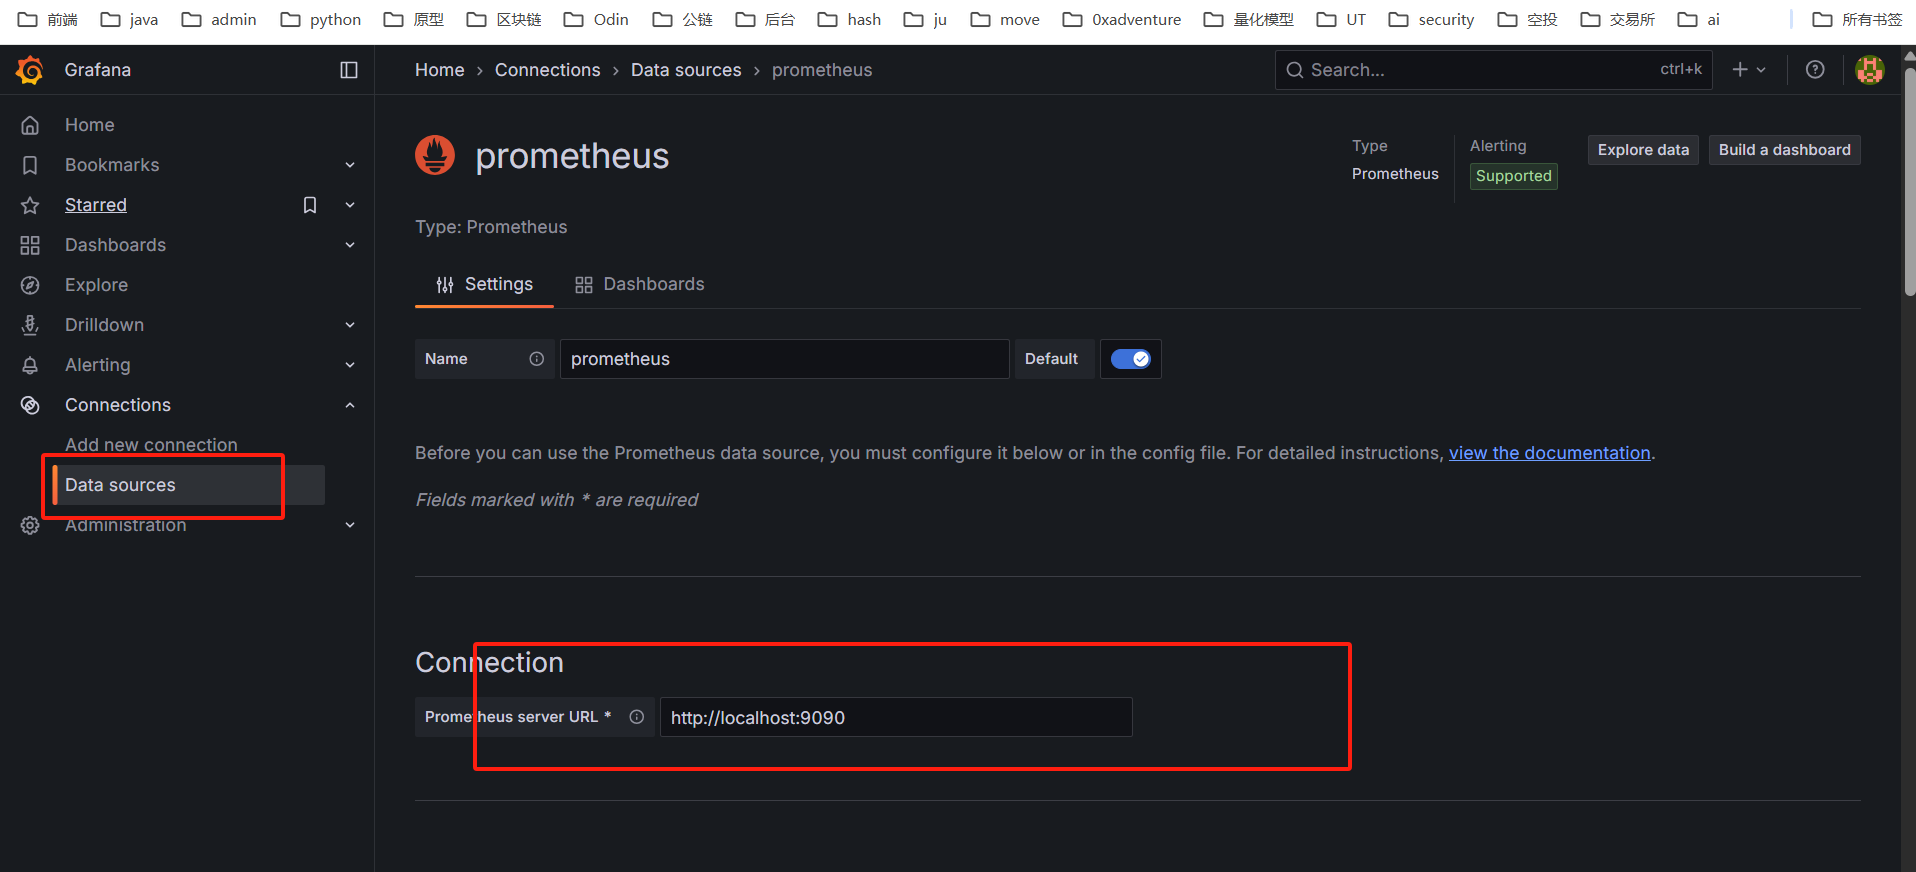
下载解压后启动,访问 http://localhost:9090/ 默认页面展示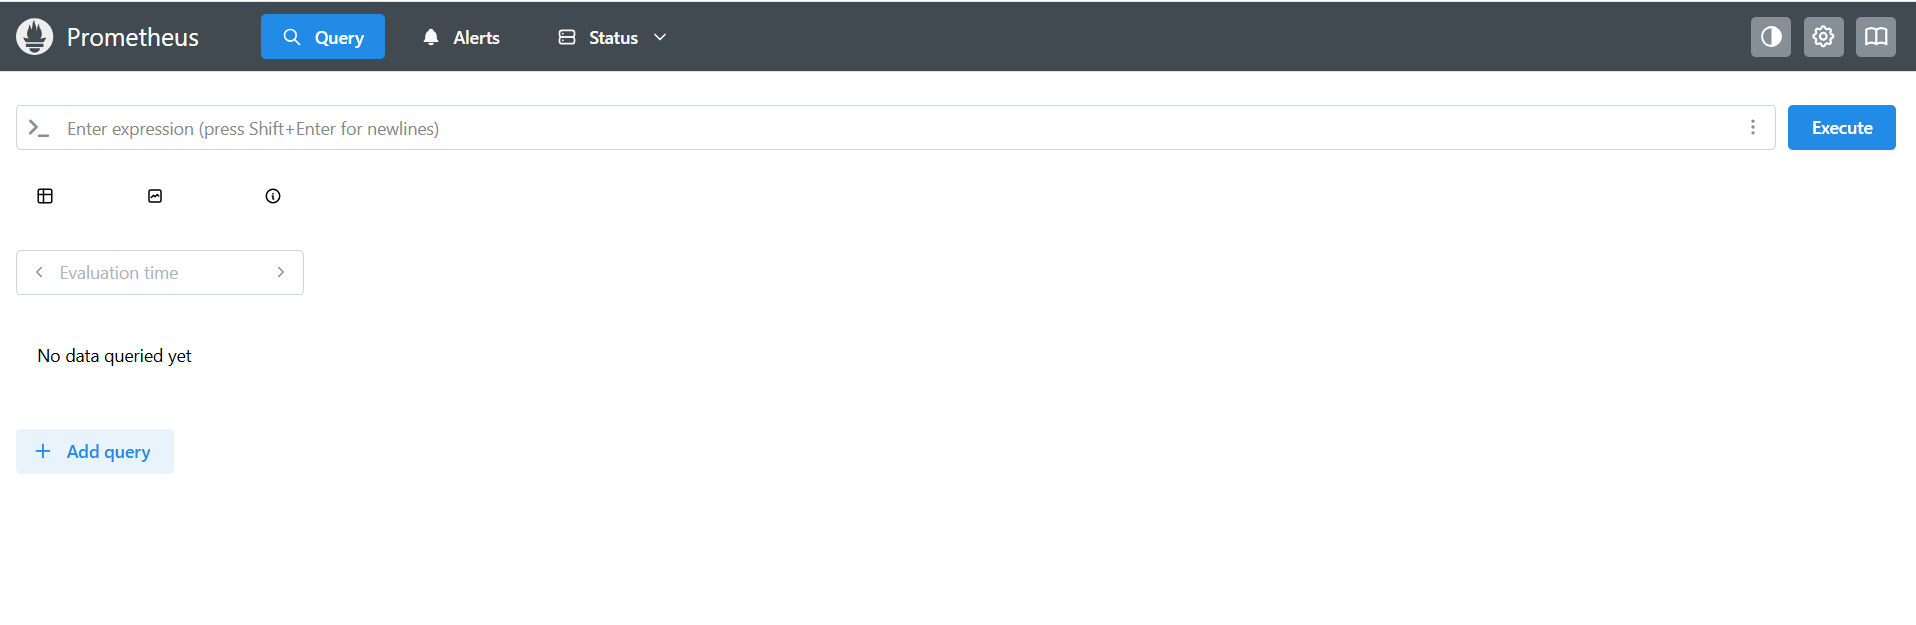
grafana
下载地址
https://grafana.com/grafana/download?platform=windows
下载后解压安装
访问 http://localhost:3000/ 账号/密码 admin/admin