ARM 性能分析工具:Streamline_arm streamline
文章目录
- 1. 前言
- 2. 安装
-
- 2.1 在 Host 安装 `Arm Performance Studio`
- 2.2 在 ARM 目标平台安装 `gatord`
- 3. 使用
-
- 3.1 离线方式
- 3.2 在线方式
- 3.3 添加符号表
- 4. 参考资料
1. 前言
限于作者能力水平,本文可能存在谬误,因此而给读者带来的损失,作者不做任何承诺。
2. 安装
Streamline 分为两大部分:
gatordArm Performance Studio
gatord 运行于目标 ARM 平台,负责性能数据采样;而 Arm Performance Studio 运行于 Host (如 Windows/Linux/MacOS 等),负责性能采样数据分析。
本文以【运行于 Windows 主机 Arm Performance Studio + 运行于 ARMv8 平台的 gatord 】组合为例进行说明。
2.1 在 Host 安装 Arm Performance Studio
到 https://developer.arm.com/Tools%20and%20Software/Arm%20Performance%20Studio#Downloads 处下载 Arm Performance Studio 的 Windows 版本进行安装:
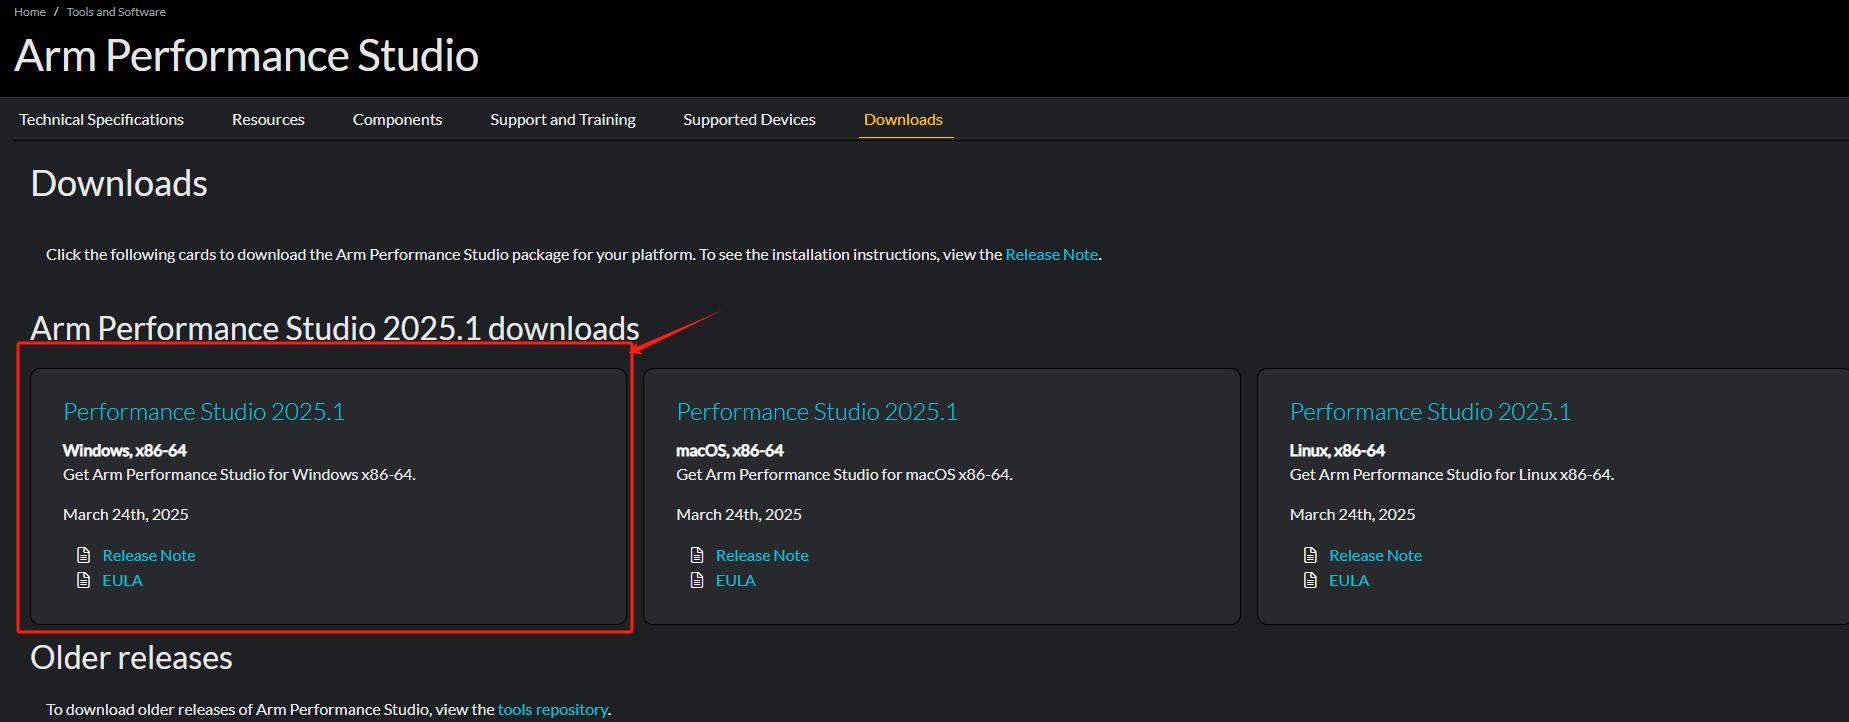
当然,读者也完全可以下载 Linux 或 macOS 版本进行安装,只是笔者用 Windows 版本进行演示。
2.2 在 ARM 目标平台安装 gatord
按 Set up your target 完成 gatord 运行环境的检验和安装。
首先检验 gatord 运行环境,Linux 需开启 CONFIG_PROFILING 配置:
# zcat /proc/config.gz | grep CONFIG_PROFILINGCONFIG_PROFILING=yArm Performance Studio 安装完成后,在路径 \\streamline\\bin\\linux 包含有预编译的 gatord 程序,其源码在路径 \\streamline\\gator\\daemon 下。将 gatord 程序拷贝到目标 ARM 平台,并增加可执行权限:
# chmod +x gatord# ./gatord -hStreamline Data Recorder v9.5.1 (Build d0e2706)Copyright (c) 2010-2025 Arm Limited. All rights reserved.Streamline has 2 modes of operation. Daemon mode (the default), and localcapture mode, which will capture to disk and then exit. To enable local capturemode specify an output directory with --output.* Arguments available to all modes: -h|--help This help page -c|--config-xml <config_xml> Specify path and filename of the configuration XML. In daemon mode the list of counters will be written to this file. In local capture mode the list of counters will be read from this file. -e|--events-xml <events_xml> Specify path and filename of the events XML to use......如果预编译的 gatord 无法在目标 ARM 平台上运行,可到 gatord 处下载源码自行编译。
3. 使用
Streamline 的使用可以有两种方式:
1. 离线方式2. 在线方式离线方式是 gatord 进行性能数据采样,并将采样数据存放在 ARM 目标机器本地存储上,结束采样后再将性能数据采样文件拷贝到 Host (Windows/Linux/macOS),然后导入到 Arm Performance Studio 进行分析。
在线方式也是 gatord 进行性能数据采样,但不同于离线方式的是,性能数据采样实时的通过 ADB 或 网络传递给 Host (Windows/Linux/macOS) 一侧的 Arm Performance Studio 并存放,结束采样后 Arm Performance Studio 再进行分析。
接下来分别对离线和在线两种方式加以说明。不管是离线还是在线方式,都要先准备一个测试程序。按 Compile your application 编译一个应用程序,拷贝到目标 ARM 机器,并添加可执行权限。
3.1 离线方式
首先在目标 ARM 机器启动 gatord 和 应用测试程序:
# ./gatord -o profile.apc &# ./test_app &一段时间后,停止应用程序和 gatord :
# killall test_app# killall gatord将采样数据文件夹 profile.apc 拷贝到 Windows 下 Arm Performance Studio 的指定目录下:
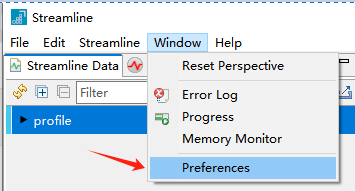
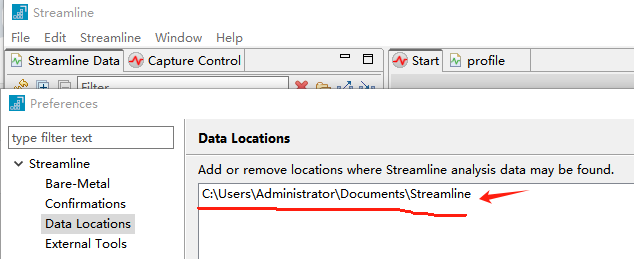
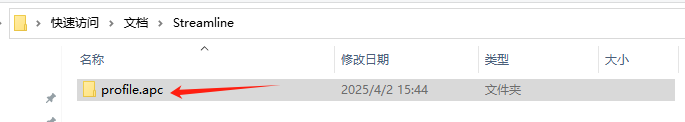
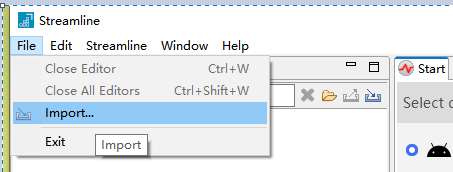
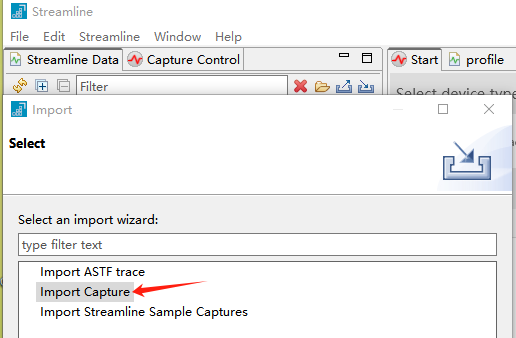
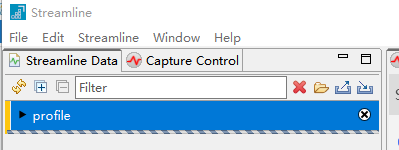
然后启动 Arm Performance Studio,并导入数据:
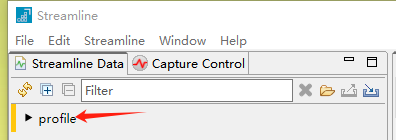
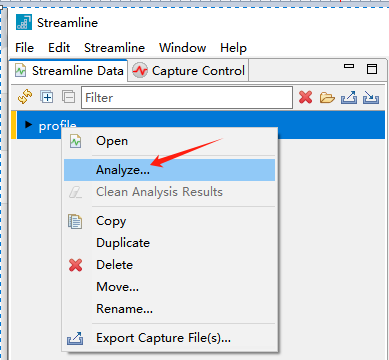
然后启动分析,这需要一点时间:
分析完成如下图:

可以标签栏 Timeline,Call Paths,Functions 等查看不同的分析数据,也可以选择指定进程的分析数据。
3.2 在线方式
# ./gatord &[1] 2584Streamline Data Recorder v9.5.1 (Build d0e2706)Copyright (c) 2010-2025 Arm Limited. All rights reserved.Gator ready# ./test_app &在 Windows 下 Arm Performance Studio,选择 TCP 方式:
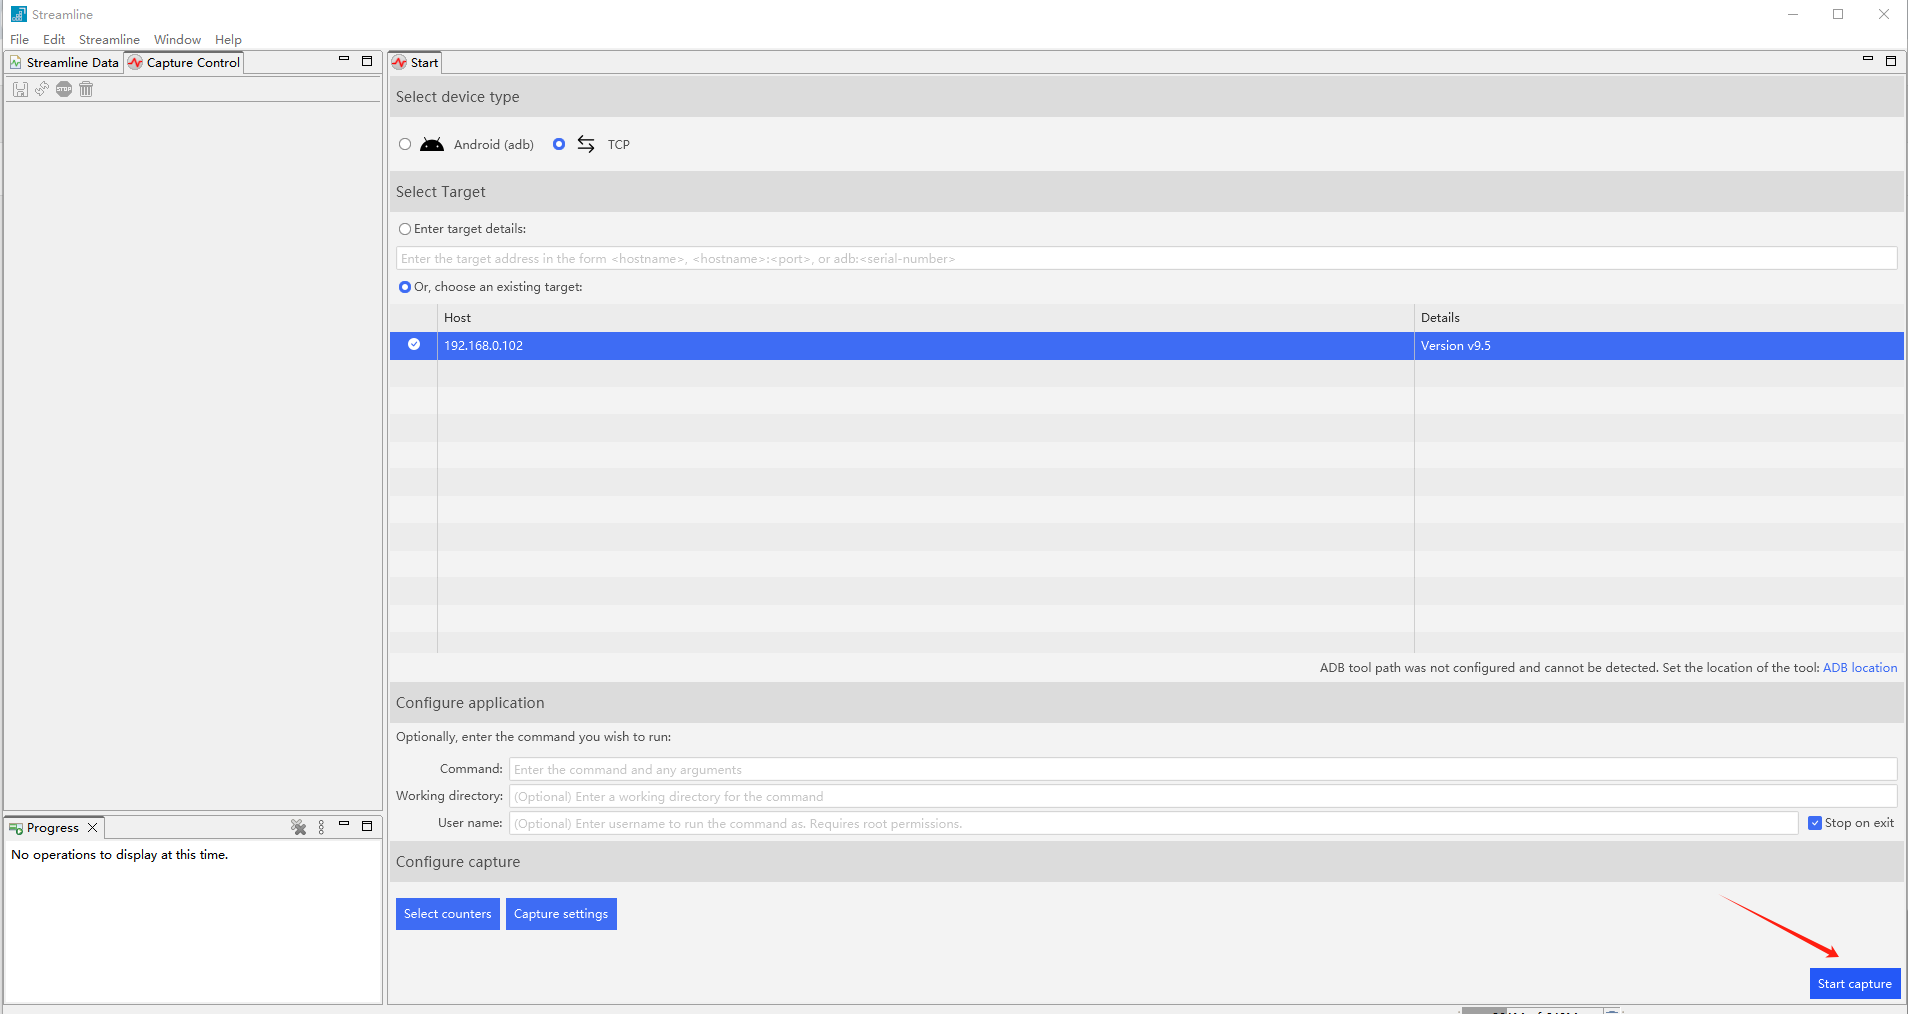
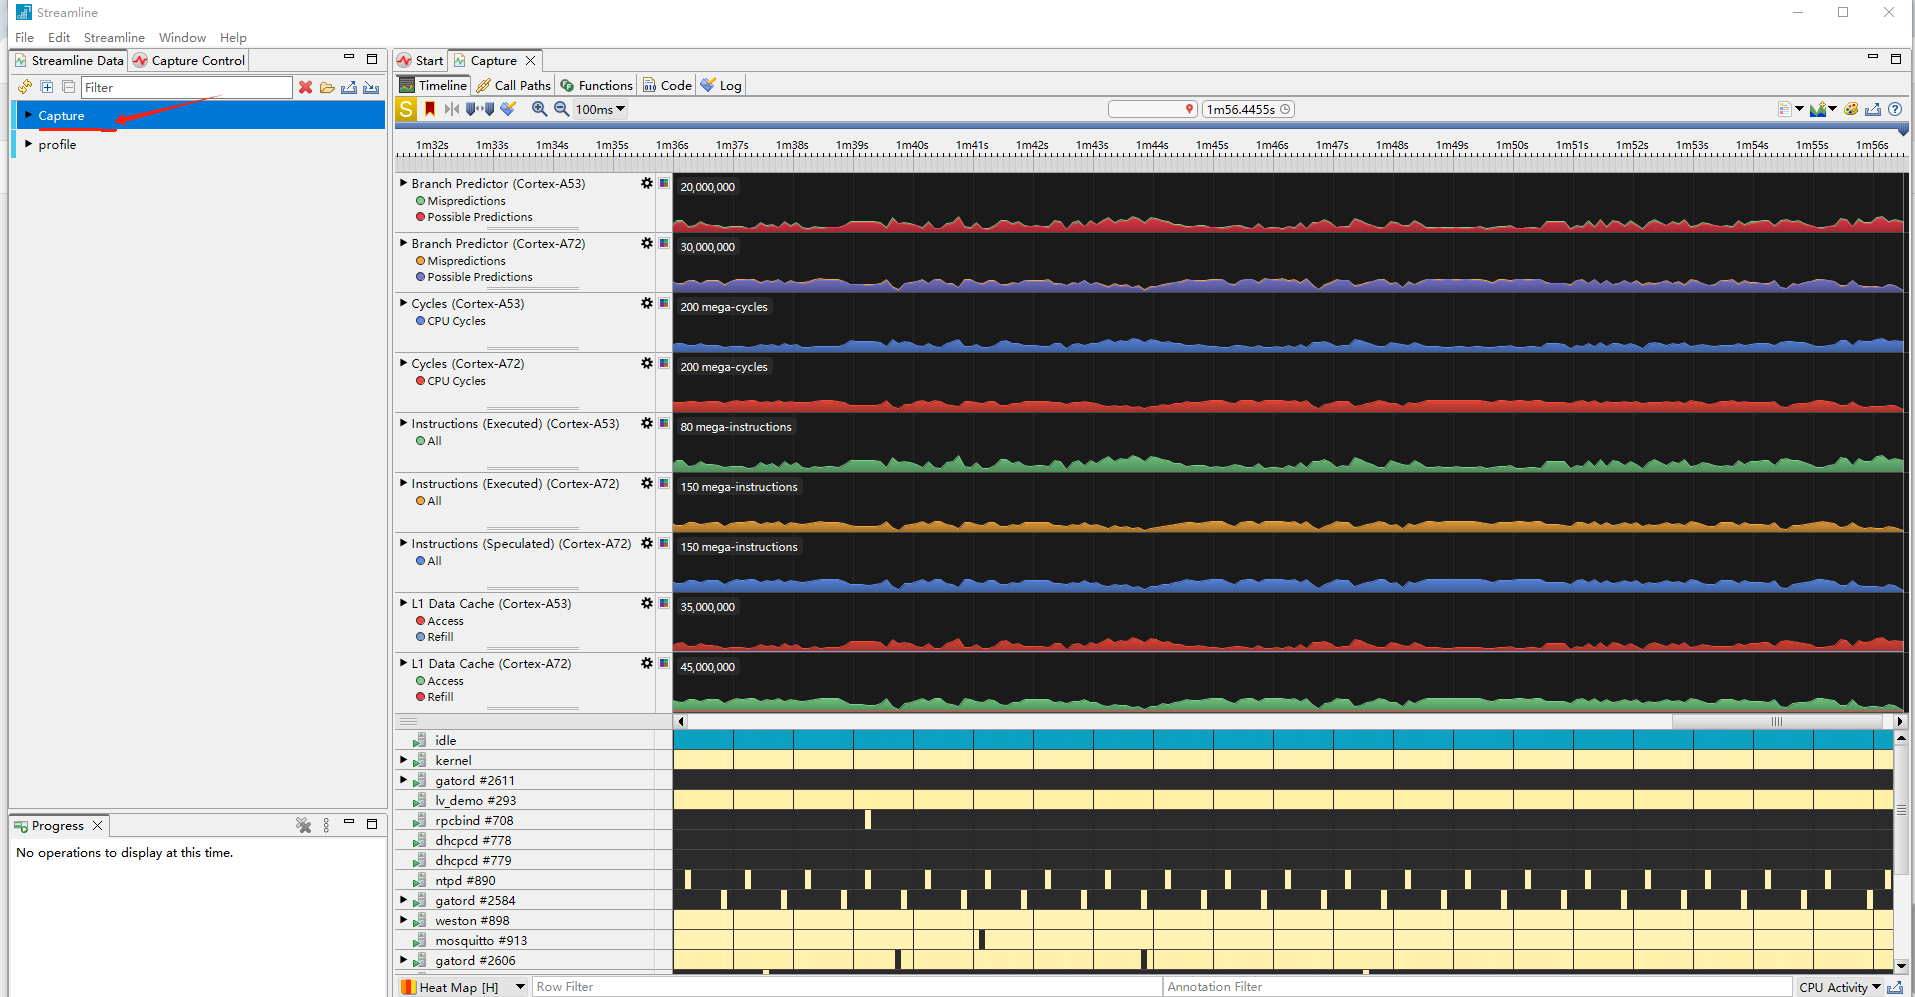
并点击 Start capture 按钮开始捕捉,出现如下画面:

停止测试应用程序和 gatord:
# killall test_app# killall gatord
Arm Performance Studio 将自动停止捕捉并开始分析数据,分析完后的画面如下:
3.3 添加符号表
默认解析是看不到任何符号信息的,要按需导入。在采样数据上点击右键:
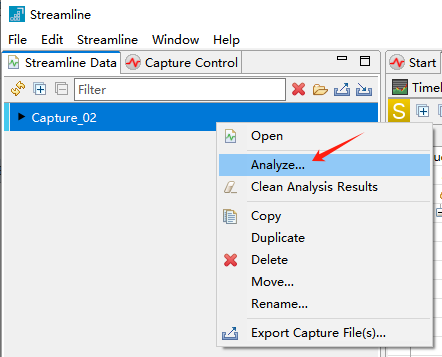
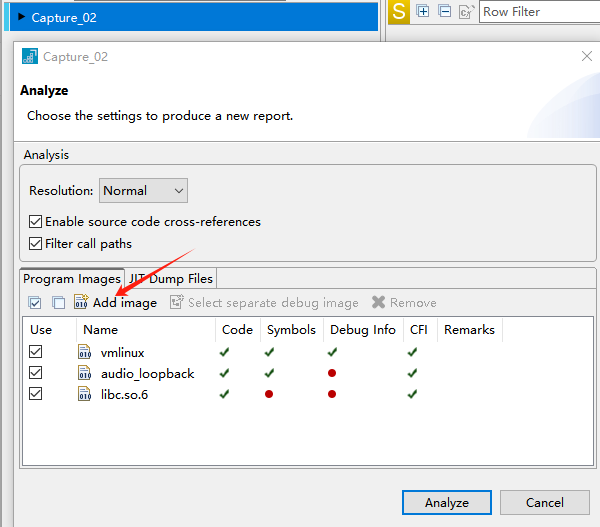
点击按钮  添加需要的符号文件,如上图中的
 vmlinux 等,然后点击 Analyze 按钮,分析后的数据就可以看到符号信息了:

Streamline 功能很多很强大,更多关于 Streamline 的用法,可参考 ARM 官方文档 。
4. 参考资料
[1] Arm Streamline Target Setup Guide for Linux
R


