【多模态】使用LLM生成html图表
【多模态】使用LLM生成html图表
- 前言
- 1 准备工作
- 2 数据分析
-
- 2.1 数据上传和下载
- 2.2 使用LLM处理数据
- 3 生成图表
-
- 3.1 生成表格
- 3.2 生成数据图
- 4 html保存为图片格式
前言
LLM只能输出纯文本的内容,在分析完数据后,如果要进一步的用图表来展示,可以有这些方式:
- 画图工具调用,实现一些画图函数,LLM生成对应的参数来调用,这种方式需要实现丰富的图表函数
- 直接输出画图的结果表示(html、mermaid等),再存储为图片格式
- LLM输出取数画图的代码,执行代码得到图表结果
1 准备工作
-
需要在阿里云的百炼平台申请LLM的api_key
-
pip install html2image
-
可以使用kaggle的测试数据
import kagglehub# Download latest versionpath = kagglehub.dataset_download(\"nishanthsalian/socioeconomic-country-profiles\")print(\"Path to dataset files:\", path)2 数据分析
- 画图时传递给LLM一个简短明晰的csv数据,先让LLM生成代码对原始数据进行加工,使用E2B运行这段代码生成结果csv,然后从E2B沙箱里面把处理好的结果下载下来,上传和下载的代码为
2.1 数据上传和下载
def upload_dataset(code_interpreter, local_path): print(\"Uploading dataset to Code Interpreter sandbox...\") dataset_path = local_path if not os.path.exists(dataset_path): raise FileNotFoundError(\"Dataset file not found\") try: with open(dataset_path, \"rb\") as f: remote_path = code_interpreter.files.write(dataset_path,f) if not remote_path: raise ValueError(\"Failed to upload dataset\") print(\"Uploaded at\", remote_path) return remote_path except Exception as error: print(\"Error during file upload:\", error) raise errordef download_file(code_interpreter, remote_path, local_path): \"\"\" 从 E2B 沙箱下载文件到本地(兼容旧版 SDK) \"\"\" try: content = code_interpreter.files.read(remote_path) # 返回 str 或 bytes,取决于内容 # 判断内容类型并选择写入模式 if isinstance(content, bytes): # 如果是 bytes(如图片、PDF),用二进制写入 with open(local_path, \"wb\") as f: f.write(content) else: # 如果是 str(如 CSV、TXT),用文本写入 with open(local_path, \"w\", encoding=\"utf-8\") as f: f.write(content) print(f\"文件下载成功: {local_path}\") except Exception as e: print(f\"下载失败: {e}\") print(f\"错误详情: {type(e).__name__}: {e}\")2.2 使用LLM处理数据
- 数据分析的prompt
task_template = \"\"\"You\'re a Python data scientist. You are given tasks to complete and you run Python code to solve them.Information about the csv dataset:{data_desc}Generally, you follow these rules:- ALWAYS FORMAT YOUR RESPONSE IN MARKDOWN- ALWAYS RESPOND ONLY WITH CODE IN CODE BLOCK LIKE THIS: ```python\' [your code here] ```\' - the Python code runs in jupyter notebook. - all code must be generated and executed in a single cell. - display visualizations using matplotlib or any other visualization library directly in the notebook. don\'t worry about saving the visualizations to a file. - you also have access to the filesystem and can read/write files. - you can install any pip package (if it exists) if you need to be running `!pip install [package]`. The usual packages for data analysis are already preinstalled though. - you can run any Python code you want, everything is running in a secure sandbox environmentYour task is:{task}Now please generate the Python code to perform the task:\"\"\"def chat_with_llm(e2b_code_interpreter, user_message, max_retries=1): print(f\"\\n{\'=\'*50}\\nUser message: {user_message}\\n{\'=\'*50}\") for attempt in range(max_retries + 1): messages = [ {\"role\": \"user\", \"content\": user_message}, ] if attempt>0: response_message = deepseek_v3.invoke(messages) else: response_message = qwen_flash.invoke(messages) print(f\"Model response: {response_message.content}\\n{\'=\'*50}\") python_code = match_code_blocks(response_message.content) if python_code != \"\": # 先进行语法校验 code_check_result = qwen_flash.invoke([{\"role\": \"user\", \"content\": code_check_template.format(code=python_code)}]) if code_check_result.content == \"GOOD\": code_interpreter_results = code_interpret(e2b_code_interpreter, python_code) return code_interpreter_results,python_code else: print(f\"Code syntax check failed, retrying... (attempt {attempt+1})\") else: print(f\"Failed to match any Python code in model\'s response {response_message}, retrying... (attempt {attempt+1})\") print(\"All attempts failed.\") return []- 任务执行部分的代码:上传数据->生成代码->执行代码->下载文件
task = \"Extract the GDP data for the top 5 countries by GDP in each region. Save the results as a CSV file. The save path should be \'/home/user/top5_gdp_by_region.csv\'.\"with Sandbox.create(api_key=E2B_API_KEY) as code_interpreter: # Upload the dataset to the code interpreter sandbox remote_path = upload_dataset(code_interpreter, \"data.csv\") data_desc = data_desc_template.format(data_online_path=remote_path.path) task_prompt = task_template.format(data_desc=data_desc, task=task) code_results,python_code = chat_with_llm( code_interpreter, task_prompt ) if code_results[0]==0: # 执行成功 first_result = code_results[1][0] download_file(code_interpreter, \"/home/user/top5_gdp_by_region.csv\", \"output_4.csv\") else: print(\'代码执行失败,重试一次\') code_results,python_code = chat_with_llm_rerun( code_interpreter, task_prompt, python_code, code_results[1].traceback, max_retries=2 ) if code_results[0]==0: # 执行成功 first_result = code_results[1][0] download_file(code_interpreter, \"/home/user/top5_gdp_by_region.csv\", \"output_4.csv\") else: raise Exception(\"No code interpreter results\")# This will render the image if you\'re running this in a notebook environment.# If you\'re running it as a script, you can save the image to a file using the Pillow library.first_result3 生成图表
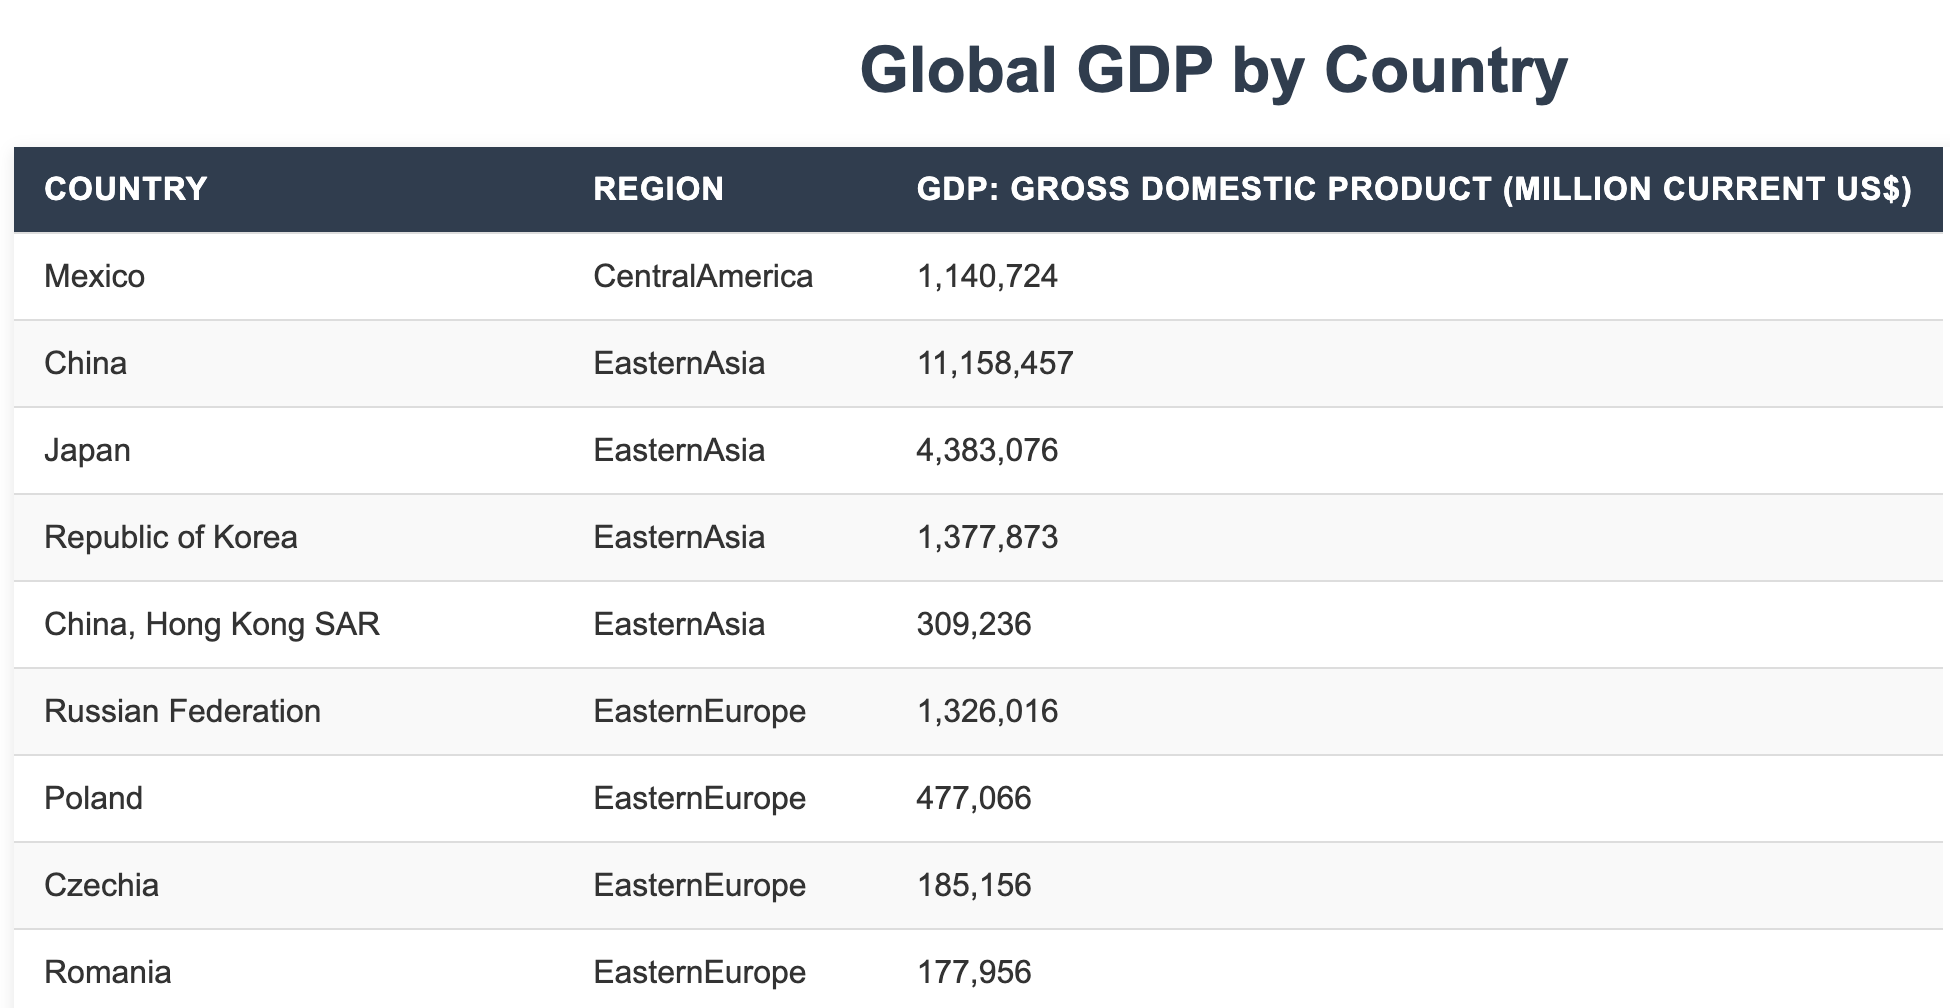
3.1 生成表格
html_table_gen_template = \"\"\"You are a helpful assistant that generates HTML tables from CSV data.Generate a complete and self-contained HTML file that displays a clean, modern, and responsive data table. The table should be styled with internal CSS (inside a tag in the ) to ensure it looks professional and is ready for screenshotting.Requirements:- Use semantic HTML: , , , , .- Include realistic sample data with at least 4 columns and 6 rows.- Apply modern styling: clean borders, alternating row colors, hover effects, proper padding, and a styled header (e.g., dark background with white text).- Make the table responsive (e.g., horizontal scroll on small screens or use of max-width).- Use a clean font (e.g., \'Segoe UI\', Arial, sans-serif).- Center the table on the page with some margin.- Do NOT use external CSS files or frameworks (like Bootstrap). All CSS must be embedded inside .- The output must be a full HTML document (include , , , ).- No explanation, only output the HTML code.The CSV data is as follows:{csv_data}\"\"\"import pandas as pdimport numpy as npcsv_data = pd.read_csv(\"output_4.csv\")csv_data_str = csv_data.to_dict(orient=\'records\')html_table_gen_prompt = html_table_gen_template.format(csv_data=csv_data_str)print(html_table_gen_prompt)html_table_response = qwen_flash.invoke(html_table_gen_prompt)with open(\"output_4.html\", \"w\") as f: f.write(html_table_response.content)
得到的表格格式会比直接markdown里面画的表格好看
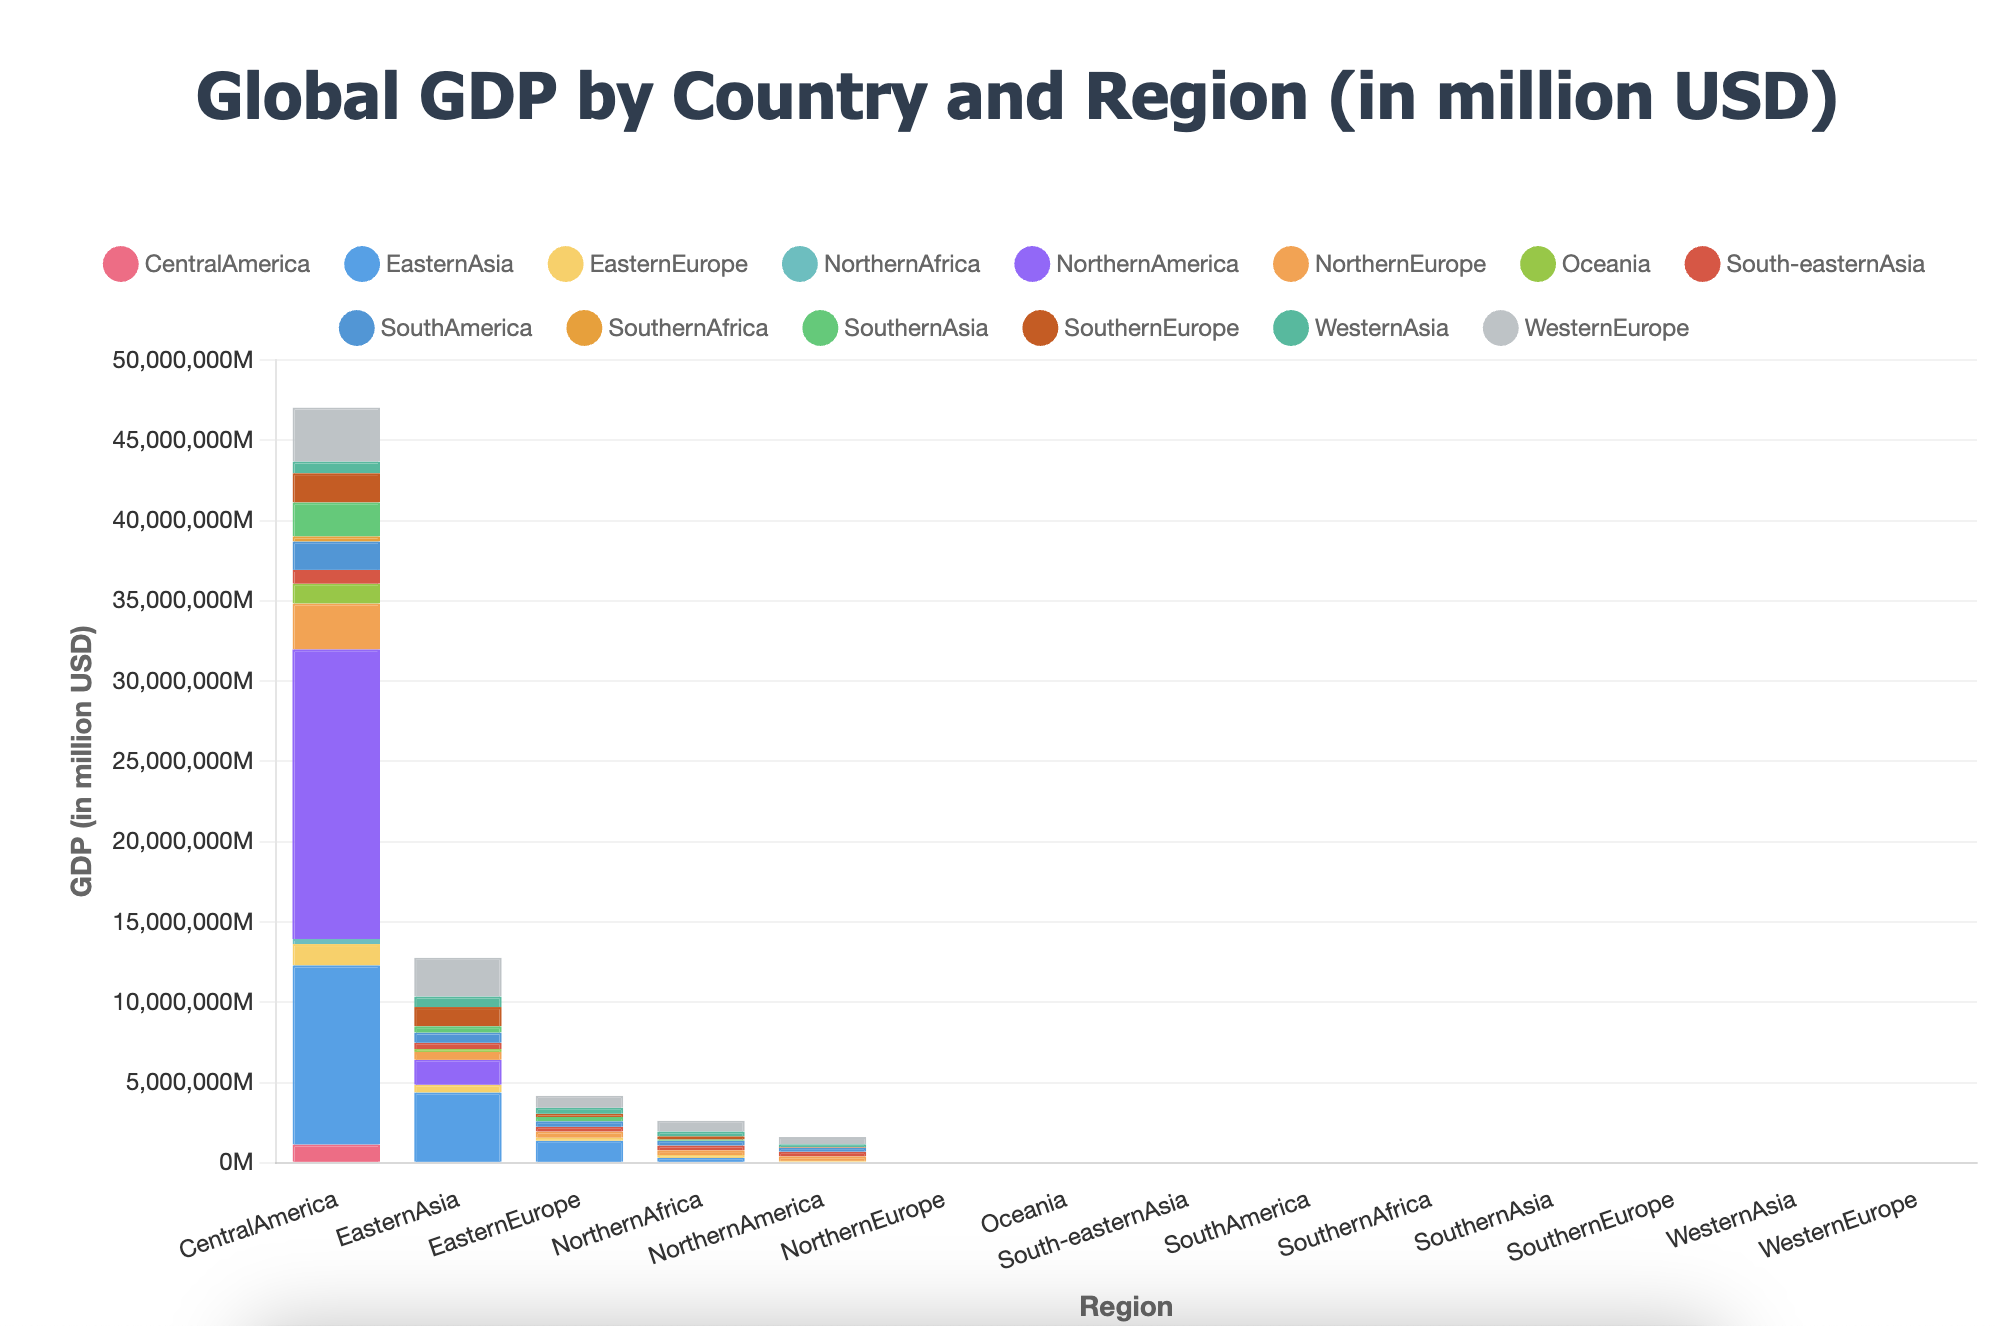
3.2 生成数据图
html_pic_gen_template = \"\"\"Generate a complete and self-contained HTML file that displays a professional-looking chart using Chart.js. The chart should render correctly in any modern browser and be suitable for screenshotting with tools like html2image.Requirements:- Use Chart.js (via CDN: https://cdn.jsdelivr.net/npm/chart.js) to create a bar chart or line chart.- Include a descriptive title above the chart.- The chart should have labeled axes, a legend (if applicable), and a clean, modern appearance.- Embed all styling with internal CSS (inside a tag) to center the chart and set a pleasant layout.- Include realistic sample data (e.g., monthly sales, product categories).- Ensure the canvas has a fixed width and height (e.g., 800x400) for consistent screenshots.- All code (HTML, CSS, JavaScript) must be in a single file. No external files.- The output must be a full HTML document (include , , , ).- No explanation, only output the HTML code.Your goal is to create a professional, insightful, and self-contained HTML document that makes the data easy to understand at a glance.The CSV data is as follows:{csv_data}\"\"\"import pandas as pdimport numpy as npcsv_data = pd.read_csv(\"output_4.csv\")csv_data_str = csv_data.to_dict(orient=\'records\')html_table_gen_prompt = html_pic_gen_template.format(csv_data=csv_data_str)print(html_table_gen_prompt)html_table_response = qwen_flash.invoke(html_table_gen_prompt)with open(\"pic_output.html\", \"w\") as f: f.write(html_table_response.content)
4 html保存为图片格式
- 这一步骤需要使用截图的方法,可以使用html2image,让图和表都放到一个
里面
- 注意如果图比较大的话,窗口大小调大一些
from selenium import webdriverfrom selenium.webdriver.chrome.service import Servicefrom selenium.webdriver.chrome.options import Optionsfrom webdriver_manager.chrome import ChromeDriverManagerdef screenshot_element(html_file, element_tag, output_png): \"\"\" 截图并保存指定HTML元素的截图。 :param html_file: 要加载的本地HTML文件路径。 :param element_tag: 目标元素的标签名或CSS选择器。 :param output_png: 输出图片文件的路径。 \"\"\" chrome_options = Options() # 设置为无头模式,即不打开浏览器窗口 chrome_options.add_argument(\"--headless\") # 确保窗口大小足够大以避免元素被裁剪 chrome_options.add_argument(\"--window-size=1920,10000\") # 使用webdriver-manager自动管理ChromeDriver service = Service(ChromeDriverManager().install()) driver = webdriver.Chrome(service=service, options=chrome_options) try: # 加载本地HTML文件 abs_path = os.path.abspath(html_file) driver.get(f\"file://{abs_path}\") # 查找目标元素 # 如果是标签名,请直接使用 \"tag name\", \"table\" # 如果是CSS选择器,请使用 \"css selector\", \".your-class-name\" element = driver.find_element(\"tag name\", element_tag) # 截取元素的截图 element.screenshot(output_png) print(f\"✅ 已保存元素截图: {output_png}\") finally: driver.quit()# --- 使用 ---screenshot_element(\'/绝对路径/pic_output.html\', \'div\', \'/绝对路径/pic_output.png\')

