从数据脱敏到SHAP解释:用Streamlit+XGBoost构建可复现的川崎病诊断系统
基于机器学习的川崎病辅助诊断工具,结合了数据预处理、模型训练、特征解释和交互式可视化。以下是深度解读:
1. 技术架构
- 框架:使用 Streamlit 构建 Web 应用,适合快速开发交互式数据科学应用。
- 核心算法:
- XGBoost:用于分类的集成学习模型,参数(如
learning_rate=0.01,max_depth=5)模仿论文中的设置。 - SHAP(SHapley Additive exPlanations):用于解释模型预测的可解释性工具。
- XGBoost:用于分类的集成学习模型,参数(如
- 数据预处理:生成模拟数据(实际应替换为医院真实数据),并划分训练/测试集。
2. 模块化设计
2.1 数据加载与模型训练
@st.cache_resourcedef load_model_and_data(): # 生成模拟数据(实际应替换为真实数据) data = pd.DataFrame({ ... }) # 特征选择 selected_features = [ ... ] X = data[selected_features] y = data[\'KD_diagnosis\'] # 划分训练/测试集 X_train, X_test, y_train, y_test = train_test_split(X, y, test_size=0.2, random_state=42) # 训练 XGBoost 模型 model = xgb.XGBClassifier(...) model.fit(X_train, y_train) # 创建 SHAP 解释器 explainer = shap.TreeExplainer(model) return model, explainer, X_train, selected_features- 关键点:
@st.cache_resource缓存模型和数据,提高性能。- 使用论文参数(如
subsample=0.8,n_estimators=300)确保结果可复现。 TreeExplainer是 SHAP 对树模型的专用解释器。
2.2 辅助函数
def anonymize_data(input_data): \"\"\"数据脱敏:使用 SHA-256 哈希保护隐私\"\"\" hashed_data = {} for key, value in input_data.items(): hasher = hashlib.sha256(f\"{key}_{value}\".encode()) hashed_data[key] = hasher.hexdigest()[:8] return hashed_data- 隐私保护:对用户输入的敏感数据(如年龄、血清钠)进行哈希处理,生成唯一匿名ID。
def generate_shap_plot(input_array): \"\"\"生成 SHAP 特征重要性图\"\"\" shap_values = explainer.shap_values(input_array) plt.figure() shap.summary_plot(shap_values, input_array, feature_names=features, show=False) plt.tight_layout() return plt- 可视化:使用
shap.summary_plot展示每个特征对模型预测的贡献,帮助医生理解诊断依据。
3. 用户界面设计
3.1 布局与交互
- 分列布局:左侧输入数据,右侧展示诊断结果和研究信息。
- 输入组件:使用
st.slider、st.number_input等组件收集10项关键指标(如年龄、CRP、白蛋白等)。 - 按钮触发:点击 \"执行川崎病诊断\" 按钮触发预测逻辑。
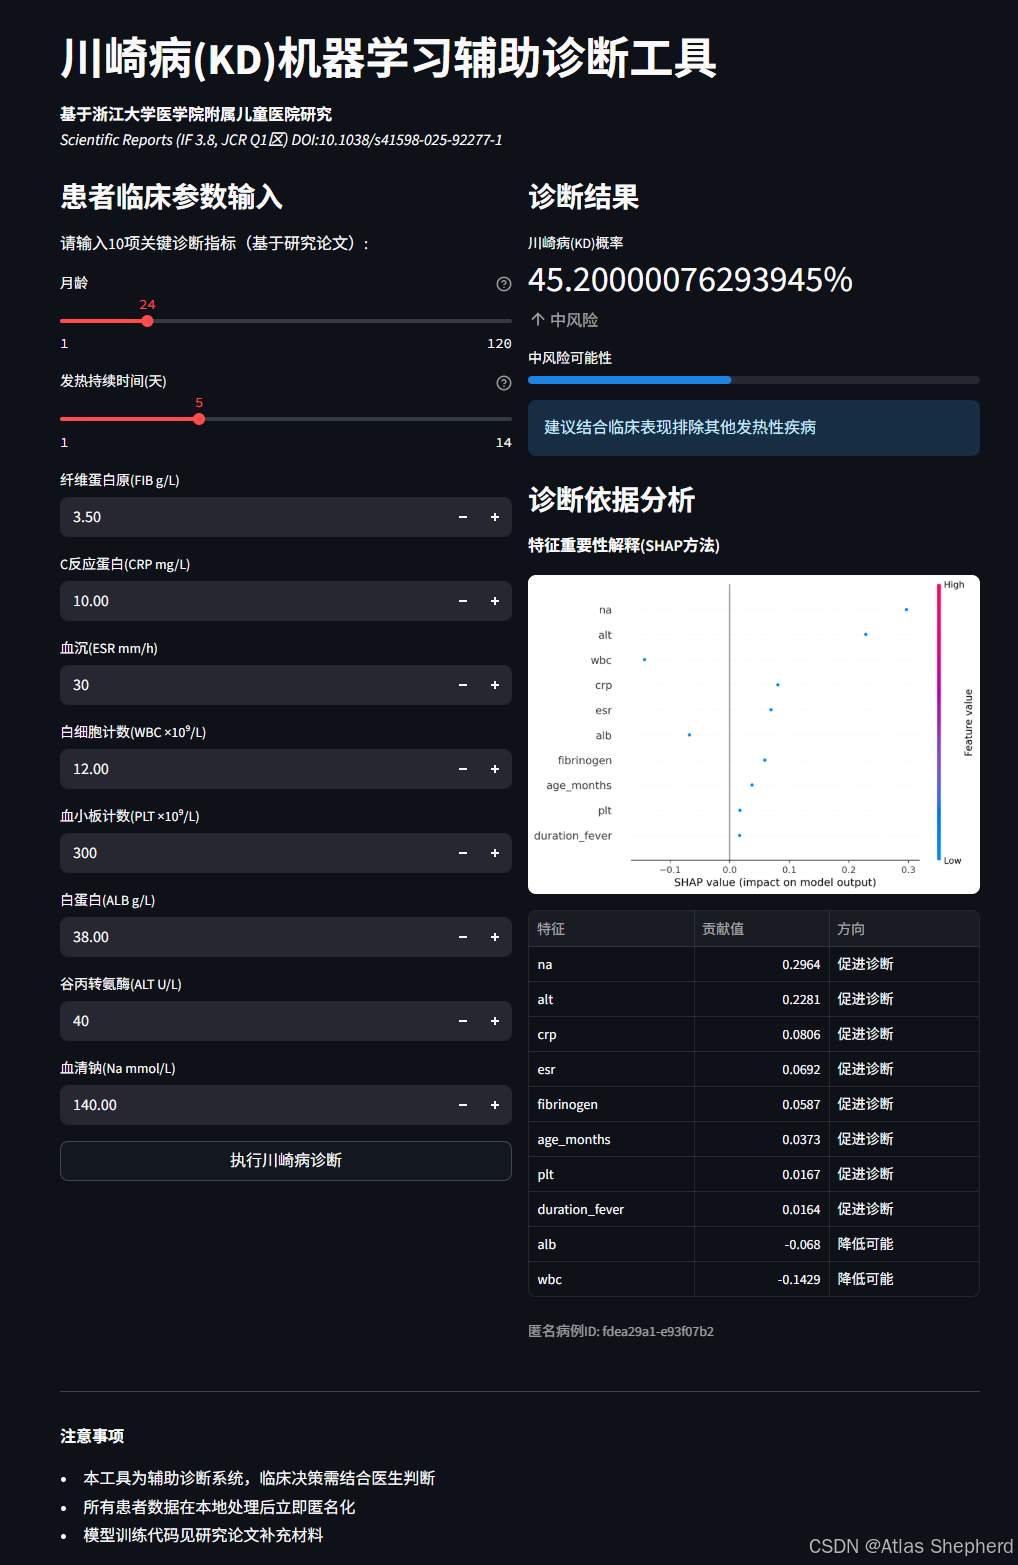
3.2 诊断结果展示
if st.button(\"执行川崎病诊断\", use_container_width=True): input_array = pd.DataFrame([input_data], columns=features) proba = model.predict_proba(input_array)[0][1] risk = \"高\" if proba > 85 else \"中\" if proba > 60 else \"低\" # 动态建议 if proba > 85: st.success(\"强烈建议进行冠状动脉超声检查并启动IVIG治疗\") # SHAP 图与表格 fig = generate_shap_plot(input_array) st.pyplot(fig) contrib_df = pd.DataFrame({ ... }) st.dataframe(contrib_df)- 风险分类:根据预测概率(
proba)分为高/中/低风险,提供不同级别的建议。 - 可解释性:通过 SHAP 图和表格展示每个特征对诊断的贡献(如 \"CRP 升高促进诊断\")。
完整代码
import streamlit as stimport pandas as pdimport numpy as npimport xgboost as xgbimport shapimport joblibfrom sklearn.model_selection import train_test_splitimport matplotlib.pyplot as pltimport base64import hashlib# ========================# 数据预处理与模型加载模块# ========================@st.cache_resourcedef load_model_and_data(): # 模拟论文中的临床数据集(实际应替换为医院真实数据) data = pd.DataFrame({ \'age_months\': np.random.randint(1, 120, 1000), # 月龄 \'fibrinogen\': np.random.uniform(1.0, 10.0, 1000), # 纤维蛋白原(FIB) \'crp\': np.random.uniform(0.1, 200.0, 1000), # C反应蛋白(CRP) \'esr\': np.random.randint(5, 120, 1000), # 血沉(ESR) \'wbc\': np.random.uniform(3.0, 30.0, 1000), # 白细胞计数(WBC) \'plt\': np.random.randint(100, 800, 1000), # 血小板计数(PLT) \'alb\': np.random.uniform(25.0, 50.0, 1000), # 白蛋白(ALB) \'alt\': np.random.randint(10, 300, 1000), # 谷丙转氨酶(ALT) \'na\': np.random.uniform(130.0, 150.0, 1000), # 血清钠(Na) \'duration_fever\': np.random.randint(1, 14, 1000), # 发热持续时间 \'KD_diagnosis\': np.random.choice([0, 1], 1000, p=[0.7, 0.3]) # 诊断标签 }) # 选择论文确定的10个关键特征 selected_features = [ \'age_months\', \'fibrinogen\', \'crp\', \'esr\', \'wbc\', \'plt\', \'alb\', \'alt\', \'na\', \'duration_fever\' ] X = data[selected_features] y = data[\'KD_diagnosis\'] # 划分训练测试集(论文方法) X_train, X_test, y_train, y_test = train_test_split( X, y, test_size=0.2, random_state=42 ) # 训练XGBoost模型(论文参数) model = xgb.XGBClassifier( learning_rate=0.01, max_depth=5, n_estimators=300, subsample=0.8, eval_metric=\'logloss\', use_label_encoder=False ) model.fit(X_train, y_train) # 创建SHAP解释器(论文方法) explainer = shap.TreeExplainer(model) return model, explainer, X_train, selected_features# 初始化模型和解释器model, explainer, X_train, features = load_model_and_data()# ========================# 辅助函数模块# ========================def anonymize_data(input_data): \"\"\"数据脱敏处理(符合医疗隐私要求)\"\"\" hashed_data = {} for key, value in input_data.items(): hasher = hashlib.sha256(f\"{key}_{value}\".encode()) hashed_data[key] = hasher.hexdigest()[:8] return hashed_datadef generate_shap_plot(input_array): \"\"\"生成SHAP解释图(论文图3方法)\"\"\" shap_values = explainer.shap_values(input_array) plt.figure() shap.summary_plot(shap_values, input_array, feature_names=features, show=False) plt.tight_layout() return plt# ========================# Streamlit 应用界面# ========================st.set_page_config( page_title=\"川崎病辅助诊断\", page_icon=\"dao\", layout=\"wide\")# 标题和介绍(符合论文描述)st.title(\"川崎病(KD)机器学习辅助诊断工具\")st.markdown(\"\"\"**基于浙江大学医学院附属儿童医院研究** *Scientific Reports (IF 3.8, JCR Q1区) DOI:10.1038/s41598-025-92277-1*\"\"\")# 创建两列布局col1, col2 = st.columns([1, 1])# ========================# 左侧:患者数据输入# ========================with col1: st.subheader(\"患者临床参数输入\") st.markdown(\"请输入10项关键诊断指标(基于研究论文):\") # 创建输入表单 input_data = {} input_data[\'age_months\'] = st.slider(\"月龄\", 1, 120, 24, help=\"患者当前月龄\") input_data[\'duration_fever\'] = st.slider(\"发热持续时间(天)\", 1, 14, 5, help=\"持续发热天数\") input_data[\'fibrinogen\'] = st.number_input(\"纤维蛋白原(FIB g/L)\", 1.0, 10.0, 3.5, step=0.1) input_data[\'crp\'] = st.number_input(\"C反应蛋白(CRP mg/L)\", 0.1, 200.0, 10.0, step=0.1) input_data[\'esr\'] = st.number_input(\"血沉(ESR mm/h)\", 5, 120, 30) input_data[\'wbc\'] = st.number_input(\"白细胞计数(WBC ×10⁹/L)\", 3.0, 30.0, 12.0, step=0.1) input_data[\'plt\'] = st.number_input(\"血小板计数(PLT ×10⁹/L)\", 100, 800, 300) input_data[\'alb\'] = st.number_input(\"白蛋白(ALB g/L)\", 25.0, 50.0, 38.0, step=0.1) input_data[\'alt\'] = st.number_input(\"谷丙转氨酶(ALT U/L)\", 10, 300, 40) input_data[\'na\'] = st.number_input(\"血清钠(Na mmol/L)\", 130.0, 150.0, 140.0, step=0.1) # 诊断按钮 if st.button(\"执行川崎病诊断\", use_container_width=True): # 转换为模型输入格式 input_array = pd.DataFrame([input_data], columns=features) # 预测诊断概率 proba = model.predict_proba(input_array)[0][1] kd_prob = round(proba * 100, 1) # 右侧显示诊断结果 with col2: st.subheader(\"诊断结果\") # 显示风险指标(论文方法) risk_level = \"高风险\" if kd_prob > 70 else \"中风险\" if kd_prob > 30 else \"低风险\" color = \"#ff4b4b\" if risk_level == \"高风险\" else \"#f0a929\" if risk_level == \"中风险\" else \"#0f9d58\" st.metric(\"川崎病(KD)概率\", f\"{kd_prob}%\",delta=risk_level, delta_color=\"off\") # 修复:确保传入的值是Python float类型 progress_value = float(kd_prob / 100) st.progress(progress_value, text=f\"{risk_level}可能性\") # 诊断建议(基于论文临床意义) if kd_prob > 85: st.success(\"强烈建议进行冠状动脉超声检查并启动IVIG治疗\") elif kd_prob > 60: st.warning(\"建议复查实验室指标并观察临床症状进展\") else: st.info(\"建议结合临床表现排除其他发热性疾病\") # SHAP解释可视化 st.subheader(\"诊断依据分析\") st.markdown(\"**特征重要性解释(SHAP方法)**\") # 生成SHAP图 fig = generate_shap_plot(input_array) st.pyplot(fig) # 特征贡献表格 shap_values = explainer.shap_values(input_array)[0] contrib_df = pd.DataFrame({ \'特征\': features, \'贡献值\': shap_values, \'方向\': [\'促进诊断\' if x > 0 else \'降低可能\' for x in shap_values] }).sort_values(\'贡献值\', ascending=False) st.dataframe(contrib_df, hide_index=True, use_container_width=True) # 数据脱敏保存(符合医疗规范) anonymized = anonymize_data(input_data) st.caption(f\"匿名病例ID: {anonymized[\'age_months\']}-{anonymized[\'crp\']}\") # 设置session状态,表示已诊断 st.session_state.diagnosed = True# ========================# 右侧:研究信息展示# ========================with col2: if not st.session_state.get(\'diagnosed\', False): st.subheader(\"研究背景\") st.markdown(\"\"\" **研究亮点** - 基于XGBoost的机器学习模型(AUC=0.9757) - 10项关键临床指标组合诊断 - SHAP可解释性算法支持临床决策 - 国家儿童健康与疾病临床医学研究中心验证 \"\"\") st.image( \"https://mmbiz.qpic.cn/mmbiz_jpg/C9DH9oqiay9Q490wNo0m7xIqBY2RLu5icB8yeTRLC229mUdW9t6vw0cib2wtcibicy0mnjuoAQL7FH0VEvaXsu7drMw/640?wx_fmt=jpeg&randomid=6ulh0iwi&tp=wxpic&wxfrom=5&wx_lazy=1\", caption=\"SU\") st.markdown(\"\"\" **使用方法** 1. 在左侧输入患者临床参数 2. 点击\"执行川崎病诊断\"按钮 3. 查看右侧诊断结果和解释分析 \"\"\")# ========================# 道;# ========================st.divider()st.markdown(\"\"\"**注意事项** - 本工具为辅助诊断系统,临床决策需结合医生判断- 所有患者数据在本地处理后立即匿名化- 模型训练代码见研究论文补充材料\"\"\")

