利用Trae将原型图转换为可执行的html文件,感受AI编程的魅力
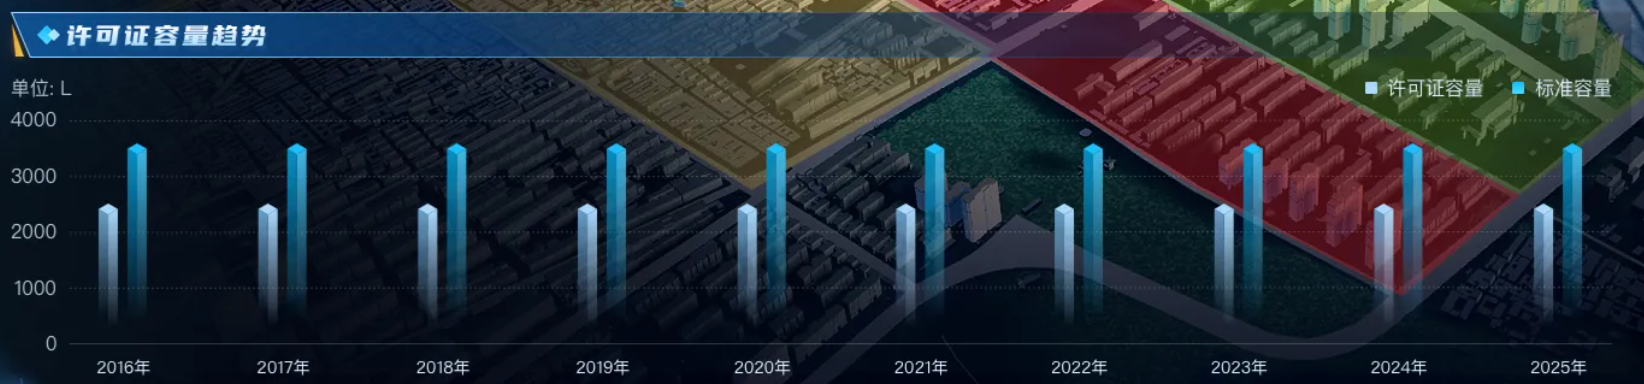
1、UI设计原型效果
2、通过Tare对话生成的效果图(5分钟左右)

3、查资料做的效果图(30分钟左右))
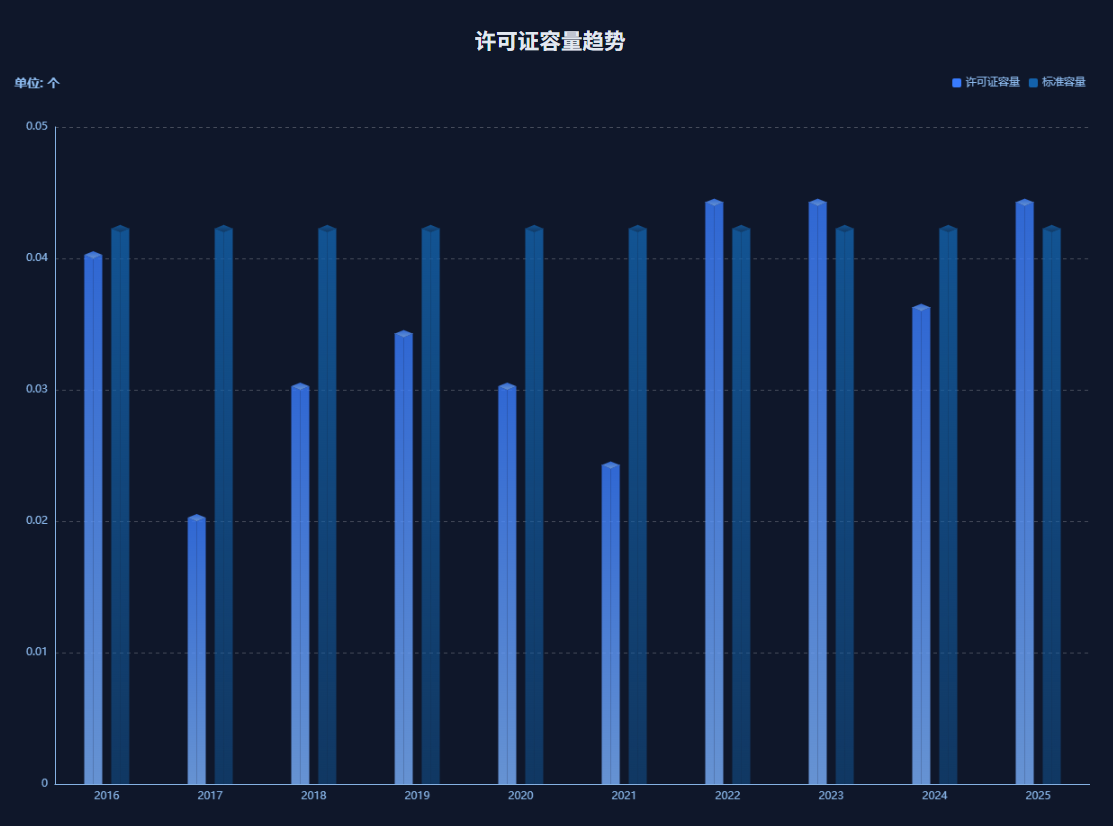
通过以上对比,显然差别不多能满足要求,只需要在继续优化就能搞定;
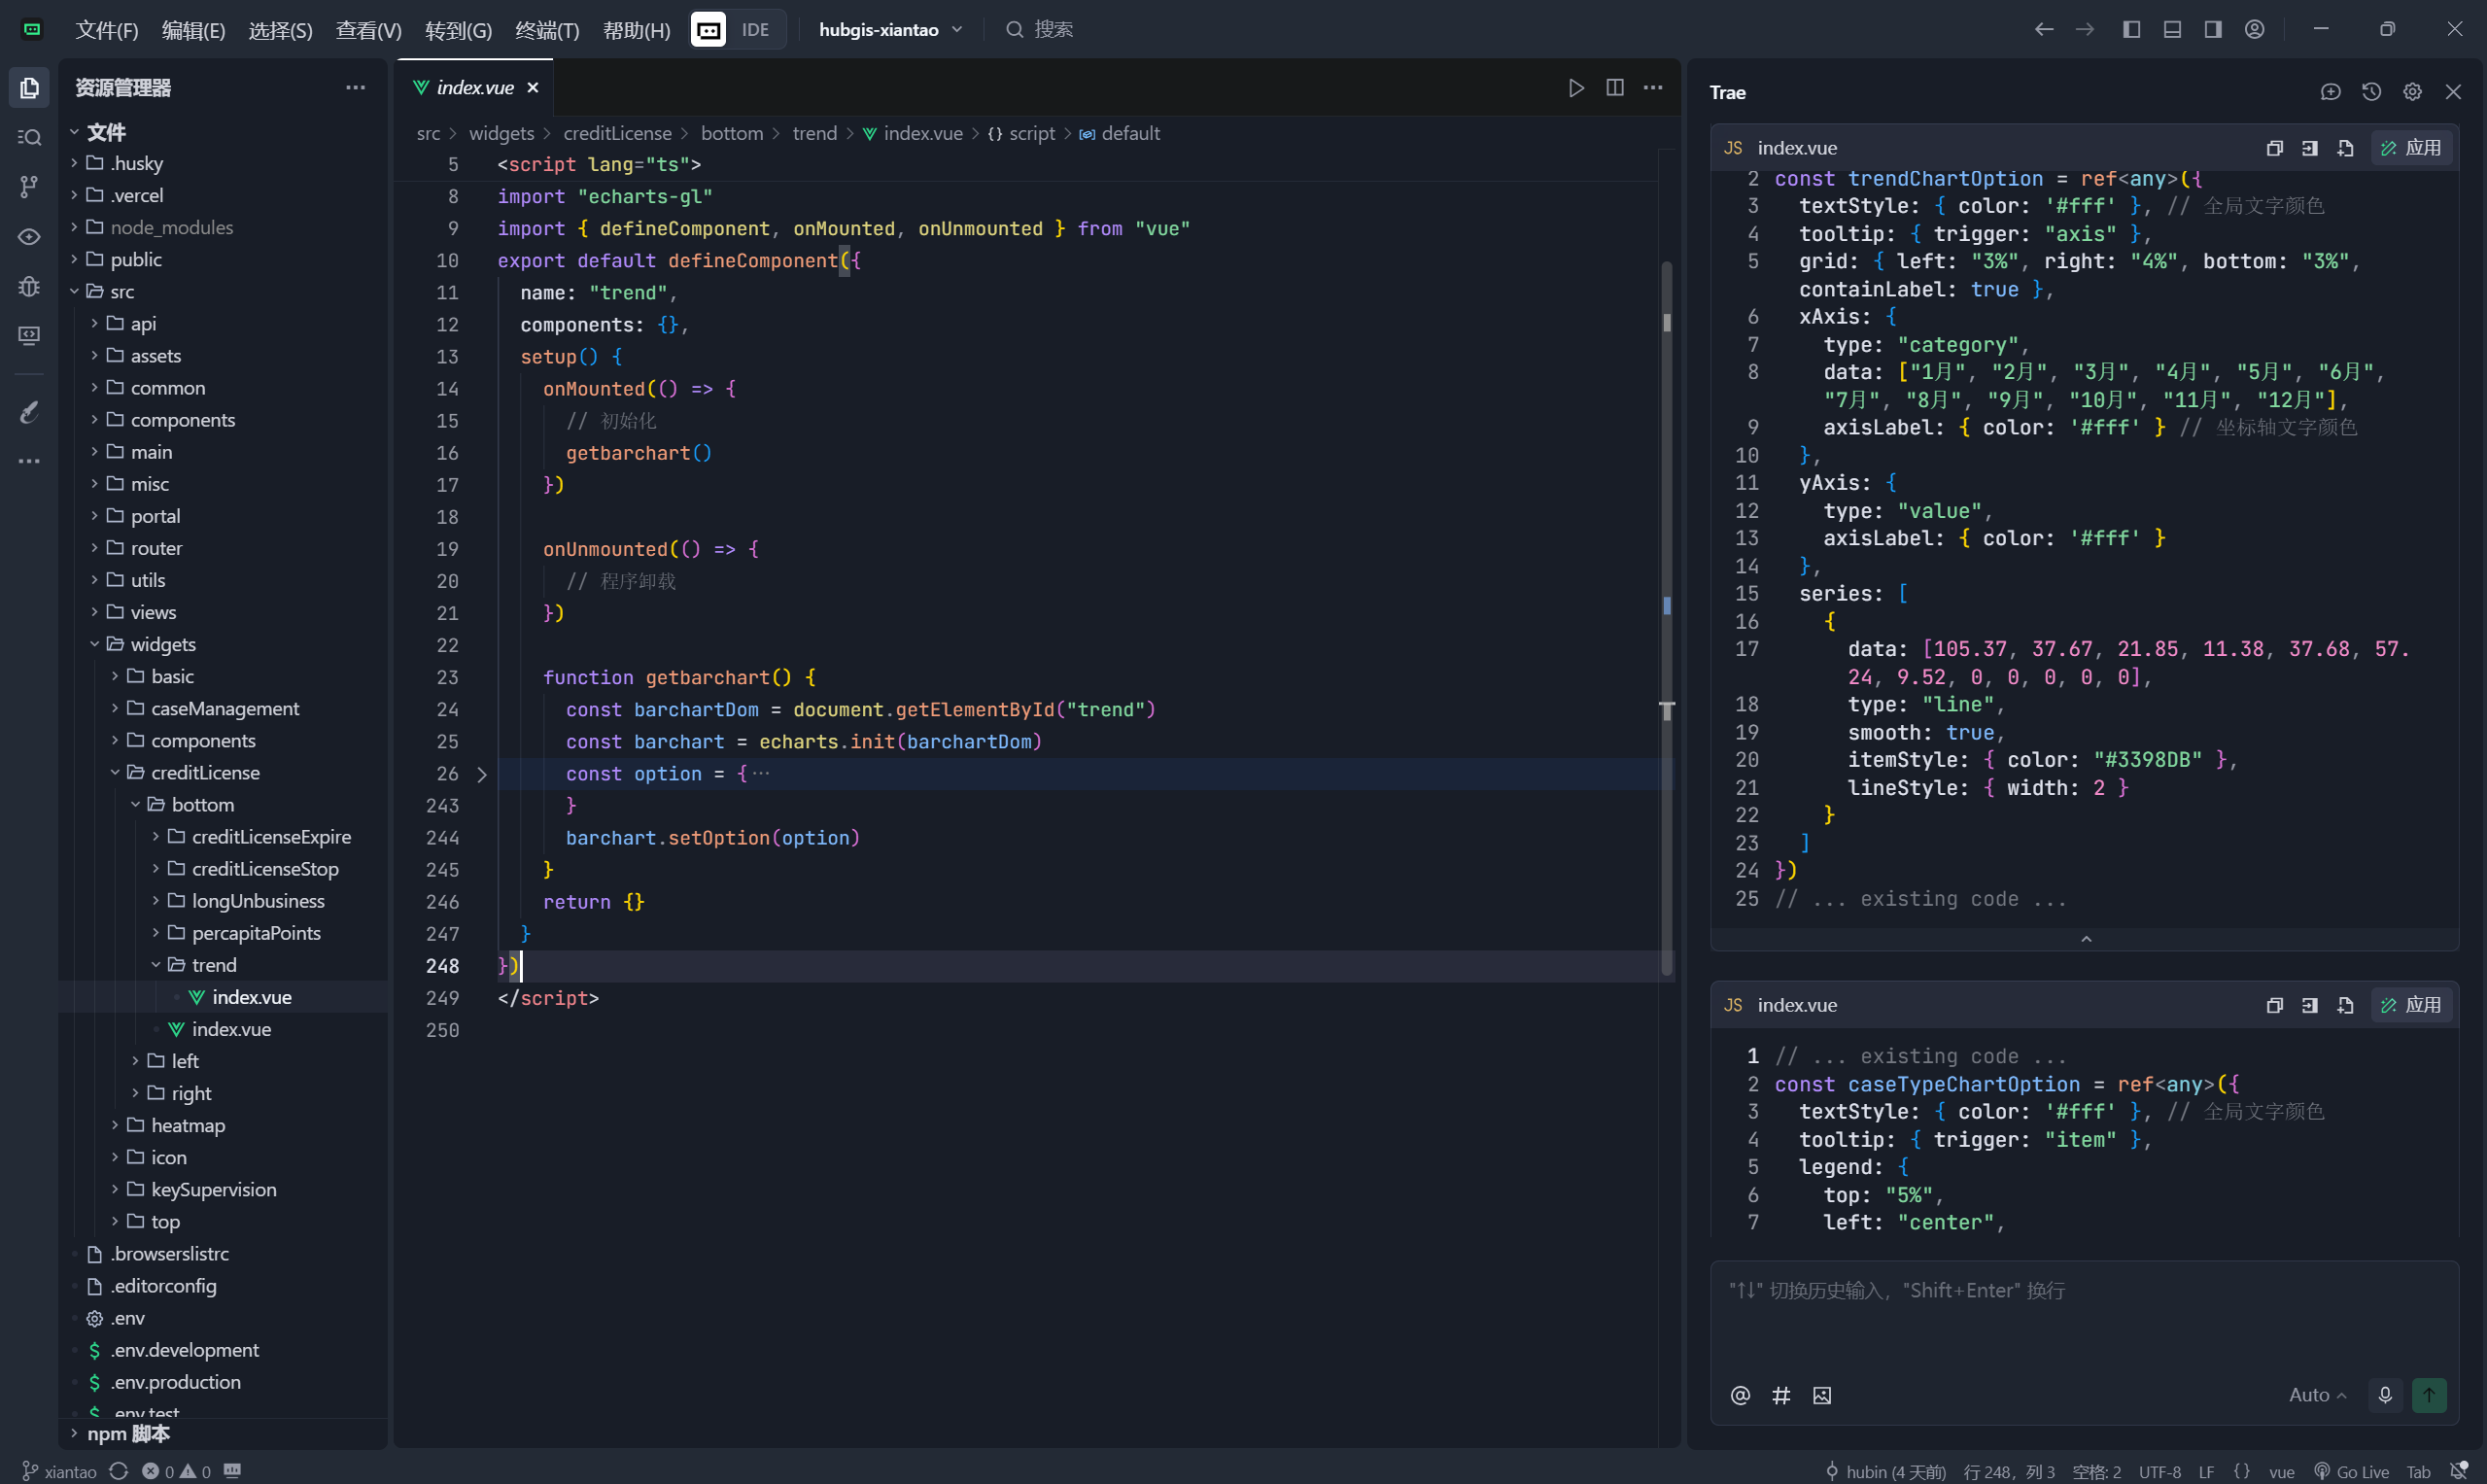
4、Trae生成的源码
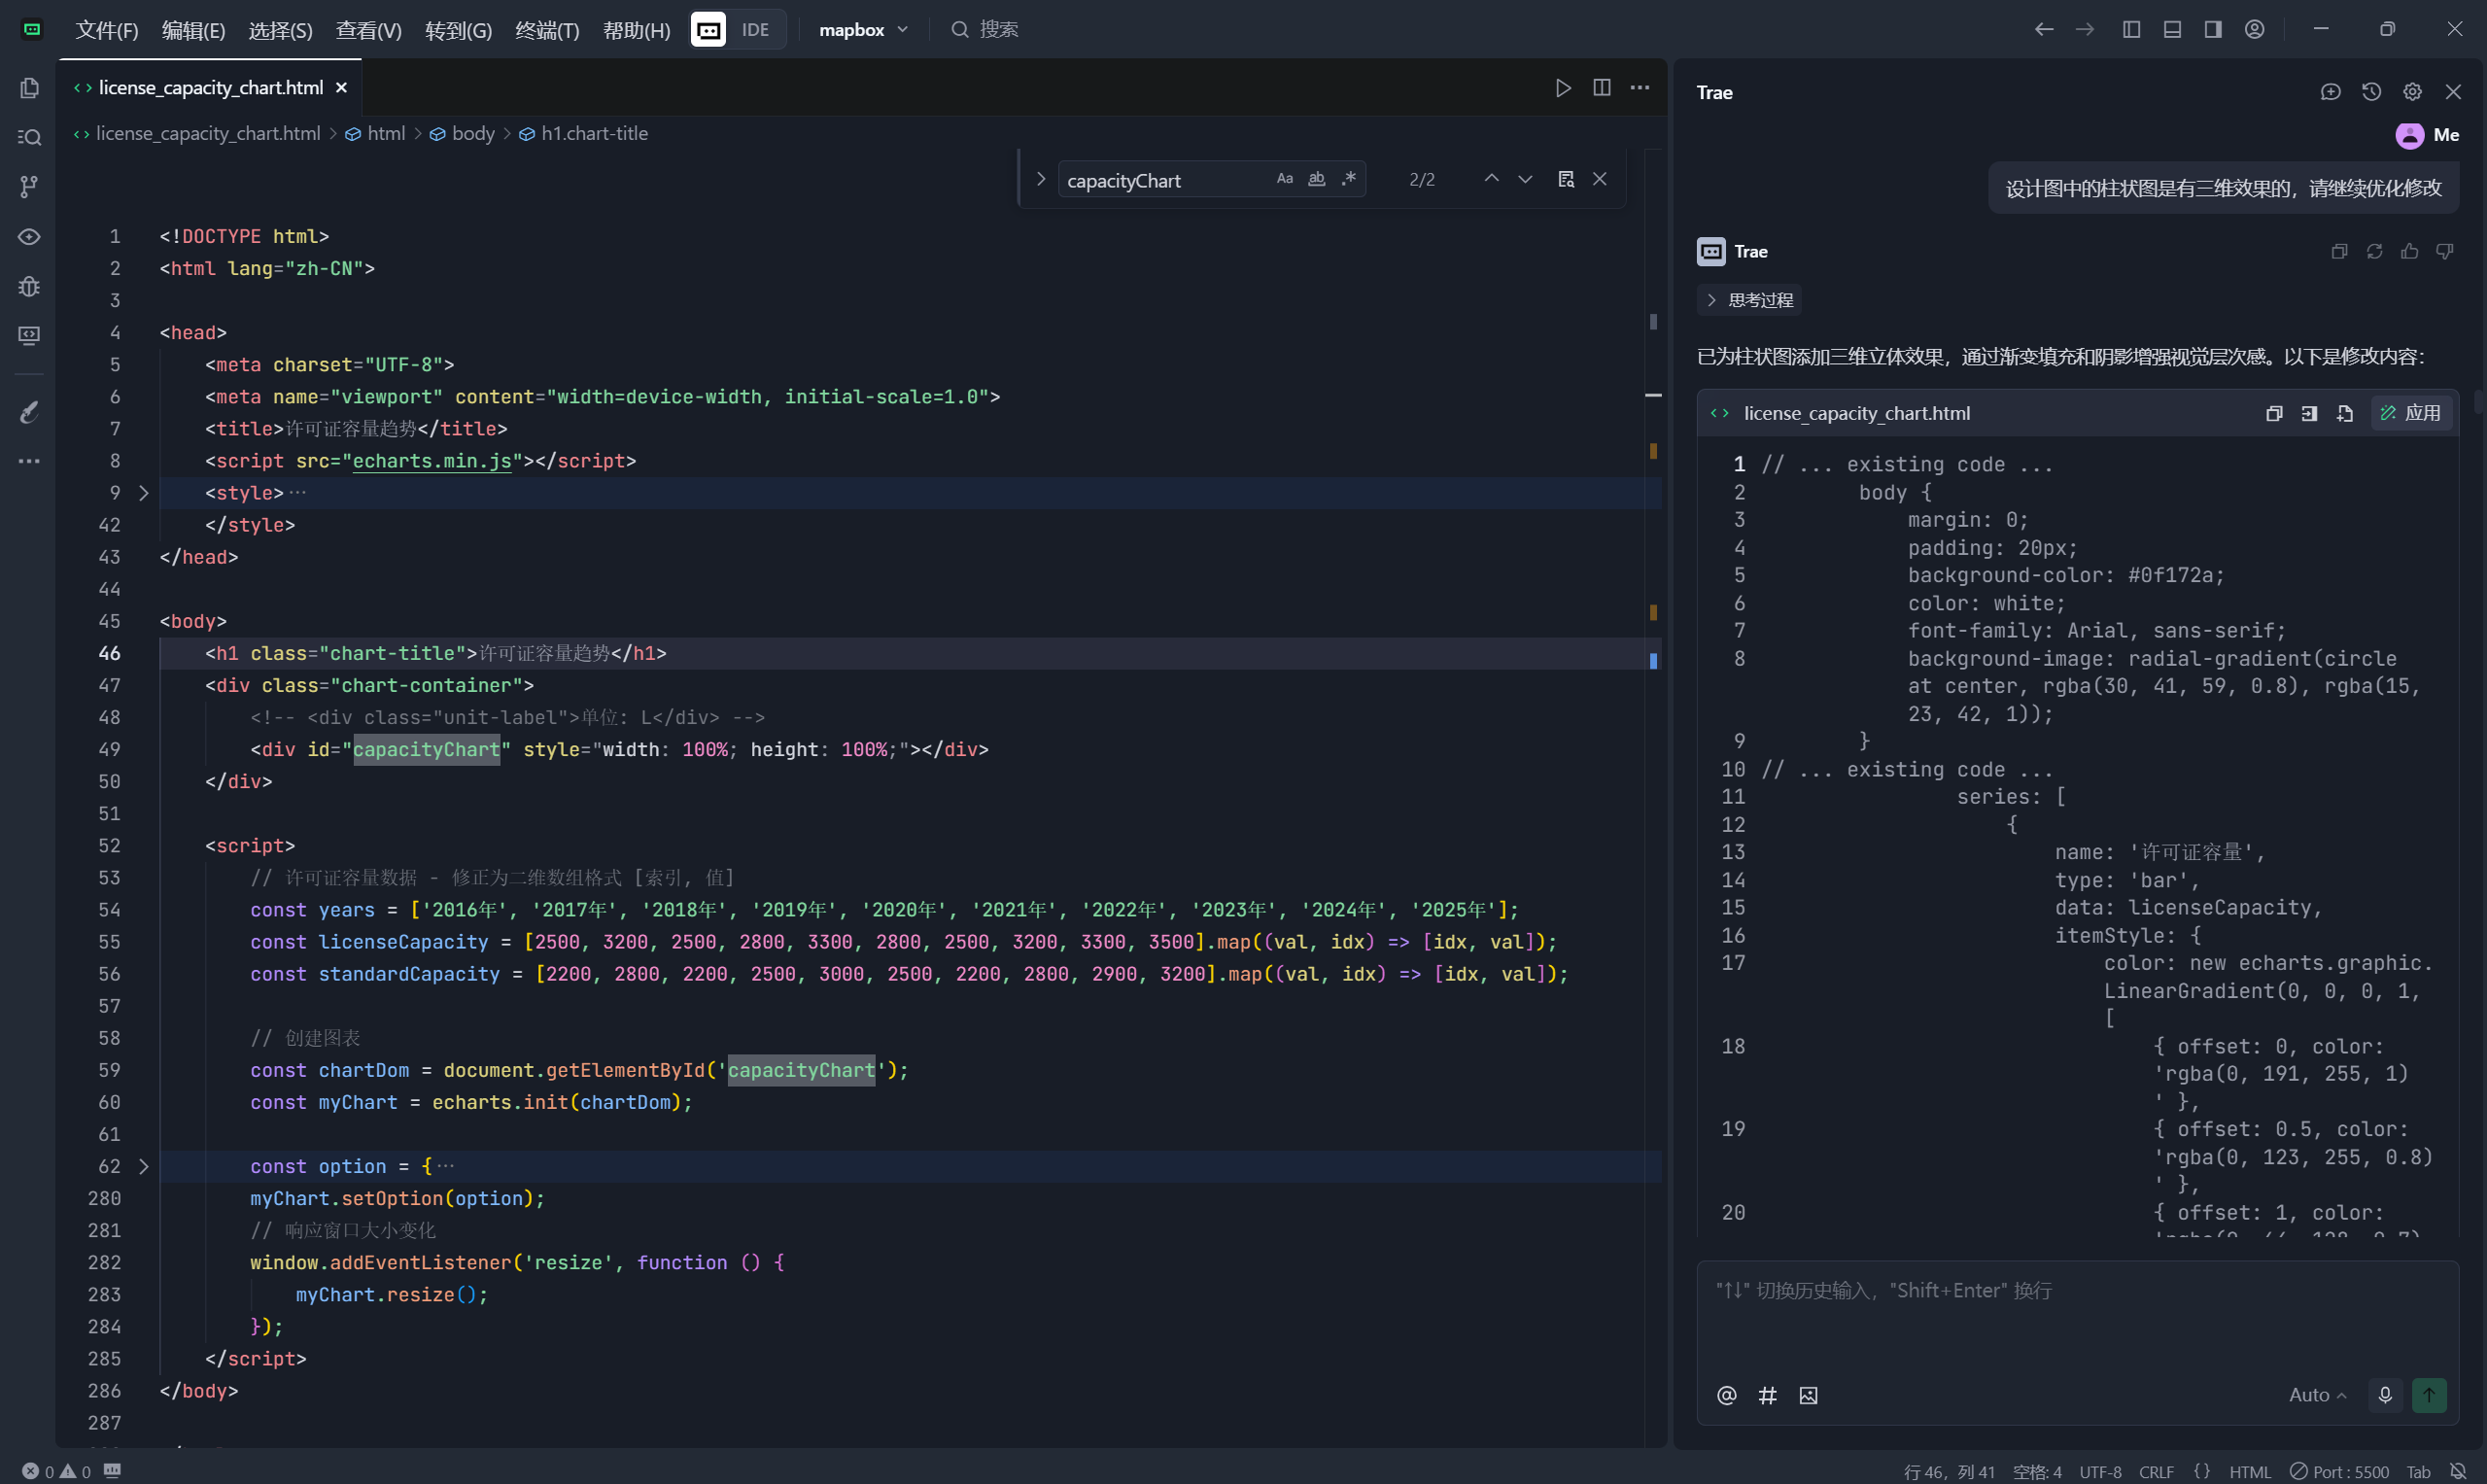
<!DOCTYPE html><html lang=\"zh-CN\"><head> <meta charset=\"UTF-8\"> <meta name=\"viewport\" content=\"width=device-width, initial-scale=1.0\"> <title>许可证容量趋势</title> <script src=\"echarts.min.js\"></script> <style> body { margin: 0; padding: 20px; background-color: #0f172a; color: white; font-family: Arial, sans-serif; } .chart-container { position: relative; width: 100%; height: 80vh; max-width: 1200px; margin: 0 auto; } .chart-title { text-align: center; font-size: 24px; margin-bottom: 20px; color: #e2e8f0; } .unit-label { position: absolute; top: 10px; left: 10px; background: rgba(15, 23, 42, 0.7); padding: 5px 10px; border-radius: 4px; font-size: 14px; } </style></head><body> <h1 class=\"chart-title\">许可证容量趋势</h1> <div class=\"chart-container\"> <!-- <div class=\"unit-label\">单位: L</div> --> <div id=\"capacityChart\" style=\"width: 100%; height: 100%;\"></div> </div> <script> // 许可证容量数据 - 修正为二维数组格式 [索引, 值] const years = [\'2016年\', \'2017年\', \'2018年\', \'2019年\', \'2020年\', \'2021年\', \'2022年\', \'2023年\', \'2024年\', \'2025年\']; const licenseCapacity = [2500, 3200, 2500, 2800, 3300, 2800, 2500, 3200, 3300, 3500].map((val, idx) => [idx, val]); const standardCapacity = [2200, 2800, 2200, 2500, 3000, 2500, 2200, 2800, 2900, 3200].map((val, idx) => [idx, val]); // 创建图表 const chartDom = document.getElementById(\'capacityChart\'); const myChart = echarts.init(chartDom); const option = { tooltip: { trigger: \'axis\', axisPointer: { type: \'shadow\' }, backgroundColor: \'rgba(15, 23, 42, 0.9)\', borderColor: \'rgba(0, 123, 255, 0.5)\', borderWidth: 1, textStyle: { color: \'rgba(255, 255, 255, 0.9)\' } }, legend: { data: [\'许可证容量\', \'标准容量\'], textStyle: { color: \'rgba(255, 255, 255, 0.9)\', fontSize: 14 }, top: 0 }, grid: { left: \'3%\', right: \'4%\', bottom: \'3%\', containLabel: true, backgroundColor: \'transparent\', borderColor: \'rgba(255, 255, 255, 0.1)\' }, xAxis: [{ type: \'category\', data: years, axisLine: { lineStyle: { color: \'rgba(255, 255, 255, 0.3)\' } }, axisLabel: { color: \'rgba(255, 255, 255, 0.7)\' }, splitLine: { lineStyle: { color: \'rgba(255, 255, 255, 0.1)\' } } }], yAxis: [{ type: \'value\', min: 0, max: 4000, interval: 1000, axisLine: { lineStyle: { color: \'rgba(255, 255, 255, 0.3)\' } }, axisLabel: { color: \'rgba(255, 255, 255, 0.7)\', formatter: \'{value}\' }, splitLine: { lineStyle: { color: \'rgba(255, 255, 255, 0.1)\' } } }], series: [ { name: \'许可证容量\', type: \'custom\', renderItem: function (params, api) { // 获取数据值和坐标 - 使用正确的维度索引 const value = api.value(1); // Y轴值 const barWidth = 40; const x = api.coord([api.value(0), 0])[0] - barWidth / 2; // X轴位置(减去宽度一半) const y = api.coord([0, value])[1]; const yAxisHeight = api.coord([0, 0])[1]; const cubeDepth = 15; // 立方体深度 // 计算三个面的坐标 // 正面 const frontPoints = [ [x, y], [x + barWidth, y], [x + barWidth, yAxisHeight], [x, yAxisHeight] ]; // 顶面 const topPoints = [ [x, y], [x + barWidth, y], [x + barWidth + cubeDepth, y - cubeDepth], [x + cubeDepth, y - cubeDepth] ]; // 右侧面 const rightPoints = [ [x + barWidth, y], [x + barWidth + cubeDepth, y - cubeDepth], [x + barWidth + cubeDepth, yAxisHeight - cubeDepth], [x + barWidth, yAxisHeight] ]; return { type: \'group\', children: [ // 右侧面 { type: \'polygon\', shape: { points: rightPoints }, style: { fill: new echarts.graphic.LinearGradient(0, 0, 1, 1, [{ offset: 0, color: \'rgba(0, 64, 128, 0.7)\' },{ offset: 1, color: \'rgba(0, 40, 80, 0.5)\' } ]), stroke: \'rgba(0, 64, 128, 0.8)\', lineWidth: 1 } }, // 正面 { type: \'polygon\', shape: { points: frontPoints }, style: { fill: new echarts.graphic.LinearGradient(0, 0, 0, 1, [{ offset: 0, color: \'rgba(0, 191, 255, 1)\' },{ offset: 1, color: \'rgba(0, 123, 255, 0.8)\' } ]), stroke: \'rgba(0, 123, 255, 1)\', lineWidth: 1 } }, // 顶面 { type: \'polygon\', shape: { points: topPoints }, style: { fill: new echarts.graphic.LinearGradient(0, 0, 1, 0, [{ offset: 0, color: \'rgba(173, 216, 230, 0.9)\' },{ offset: 1, color: \'rgba(0, 191, 255, 0.7)\' } ]), stroke: \'rgba(173, 216, 230, 0.8)\', lineWidth: 1 } } ] }; }, data: licenseCapacity, encode: { x: 0, // 使用数据的第0维度作为X轴索引 y: 1 // 使用数据的第1维度作为Y轴值 } }, { name: \'标准容量\', type: \'custom\', renderItem: function (params, api) { // 获取数据值和坐标 - 使用正确的维度索引 const value = api.value(1); // Y轴值 const barWidth = 40; const x = api.coord([api.value(0), 0])[0] + barWidth / 2; // X轴位置(加上宽度一半) const y = api.coord([0, value])[1]; const yAxisHeight = api.coord([0, 0])[1]; const cubeDepth = 15; // 立方体深度 // 计算三个面的坐标 // 正面 const frontPoints = [ [x, y], [x + barWidth, y], [x + barWidth, yAxisHeight], [x, yAxisHeight] ]; // 顶面 const topPoints = [ [x, y], [x + barWidth, y], [x + barWidth + cubeDepth, y - cubeDepth], [x + cubeDepth, y - cubeDepth] ]; // 右侧面 const rightPoints = [ [x + barWidth, y], [x + barWidth + cubeDepth, y - cubeDepth], [x + barWidth + cubeDepth, yAxisHeight - cubeDepth], [x + barWidth, yAxisHeight] ]; return { type: \'group\', children: [ // 右侧面 { type: \'polygon\', shape: { points: rightPoints }, style: { fill: new echarts.graphic.LinearGradient(0, 0, 1, 1, [{ offset: 0, color: \'rgba(139, 0, 0, 0.7)\' },{ offset: 1, color: \'rgba(101, 31, 31, 0.5)\' } ]), stroke: \'rgba(139, 0, 0, 0.8)\', lineWidth: 1 } }, // 正面 { type: \'polygon\', shape: { points: frontPoints }, style: { fill: new echarts.graphic.LinearGradient(0, 0, 0, 1, [{ offset: 0, color: \'rgba(255, 105, 180, 1)\' },{ offset: 1, color: \'rgba(255, 0, 0, 0.8)\' } ]), stroke: \'rgba(255, 0, 0, 1)\', lineWidth: 1 } }, // 顶面 { type: \'polygon\', shape: { points: topPoints }, style: { fill: new echarts.graphic.LinearGradient(0, 0, 1, 0, [{ offset: 0, color: \'rgba(255, 182, 193, 0.9)\' },{ offset: 1, color: \'rgba(255, 105, 180, 0.7)\' } ]), stroke: \'rgba(255, 182, 193, 0.8)\', lineWidth: 1 } } ] }; }, data: standardCapacity, encode: { x: 0, // 使用数据的第0维度作为X轴索引 y: 1 // 使用数据的第1维度作为Y轴值 } } ] }; myChart.setOption(option); // 响应窗口大小变化 window.addEventListener(\'resize\', function () { myChart.resize(); }); </script></body></html>5、最终的效果图源码
<!DOCTYPE html><html lang=\"zh-CN\"><head> <meta charset=\"UTF-8\"> <meta name=\"viewport\" content=\"width=device-width, initial-scale=1.0\"> <title>许可证容量趋势</title> <script src=\"echarts.min.js\"></script> <style> body { margin: 0; padding: 20px; background-color: #0f172a; color: white; font-family: Arial, sans-serif; } .chart-container { position: relative; width: 100%; height: 80vh; max-width: 1200px; margin: 0 auto; } .chart-title { text-align: center; font-size: 24px; margin-bottom: 20px; color: #e2e8f0; } .unit-label { position: absolute; top: 10px; left: 10px; background: rgba(15, 23, 42, 0.7); padding: 5px 10px; border-radius: 4px; font-size: 14px; } </style></head><body> <h1 class=\"chart-title\">许可证容量趋势</h1> <div class=\"chart-container\"> <!-- <div class=\"unit-label\">单位: L</div> --> <div id=\"capacityChart\" style=\"width: 100%; height: 100%;\"></div> </div> <script> // 许可证容量数据 - 修正为二维数组格式 [索引, 值] const years = [\'2016年\', \'2017年\', \'2018年\', \'2019年\', \'2020年\', \'2021年\', \'2022年\', \'2023年\', \'2024年\', \'2025年\']; const licenseCapacity = [2500, 3200, 2500, 2800, 3300, 2800, 2500, 3200, 3300, 3500].map((val, idx) => [idx, val]); const standardCapacity = [2200, 2800, 2200, 2500, 3000, 2500, 2200, 2800, 2900, 3200].map((val, idx) => [idx, val]); // 创建图表 const chartDom = document.getElementById(\'capacityChart\'); const myChart = echarts.init(chartDom); const option = { grid: { bottom: \"20px\", left: \"50px\", // 左边距为容器宽度的 50px right: \"0px\" // 右边距为容器宽度的 0px }, // 左上角显示单位 title: { text: \"单位: 个\", left: \"left\", top: \"top\", textStyle: { color: \"#8CBAEE\", fontSize: 14 } }, // 右上角显示图例 legend: { width: \"200px\", orient: \"horizontal\", // 设置图例水平排列 data: [\"许可证容量\", \"标准容量\"], right: \"right\", top: \"top\", textStyle: { color: \"#8CBAEE\" }, itemType: \"rect\", // 指定图例图标为矩形 itemWidth: 10, // 设置矩形宽度 itemHeight: 10 // 设置矩形高度 }, xAxis: { data: [\"2016\", \"2017\", \"2018\", \"2019\", \"2020\", \"2021\", \"2022\", \"2023\", \"2024\", \"2025\"], axisLabel: { color: \"#8CBAEE\" // rotate: -60 }, axisLine: { lineStyle: { color: \"#8CBAEE\" } }, axisTick: { show: false } }, yAxis: { axisLabel: { color: \"#8CBAEE\" }, axisLine: { lineStyle: { color: \"#8CBAEE\" } }, axisTick: { show: false }, splitLine: { lineStyle: { color: \"#FFFFFF3C\", // 设置颜色为白色 type: \"dashed\" // 设置为虚线 } } }, // 立方体柱状 series: [ { type: \"custom\", name: \"许可证容量\", // 手动指定图例颜色 color: \"#387BFE\", data: [0.04, 0.02, 0.03, 0.034, 0.03, 0.024, 0.044, 0.044, 0.036, 0.044], renderItem: (params, api) => { const basicsCoord = api.coord([api.value(0), api.value(1)]) const topBasicsYAxis = basicsCoord[1] const basicsXAxis = basicsCoord[0] - 15 // 向左偏移 15px const bottomYAxis = api.coord([api.value(0), 0])[1] return { type: \"group\", children: [ // 左侧 { type: \"polygon\", shape: { points: [[basicsXAxis - 10, topBasicsYAxis - 4],[basicsXAxis - 10, bottomYAxis],[basicsXAxis, bottomYAxis],[basicsXAxis, topBasicsYAxis] ] }, style: { fill: new echarts.graphic.LinearGradient(0, 0, 0, 1, [{ offset: 0, color: \"#387BFE\" },{ offset: 1, color: \"#7CB1FD\" } ]), opacity: 0.8 // 设置半透明 } }, // 右侧 { type: \"polygon\", shape: { points: [[basicsXAxis, topBasicsYAxis],[basicsXAxis, bottomYAxis],[basicsXAxis + 10, bottomYAxis],[basicsXAxis + 10, topBasicsYAxis - 4] ] }, style: { fill: new echarts.graphic.LinearGradient(0, 0, 0, 1, [{ offset: 0, color: \"#387BFE\" },{ offset: 1, color: \"#7CB1FD\" } ]), opacity: 0.8 // 设置半透明 } }, // 顶部 { type: \"polygon\", shape: { points: [[basicsXAxis, topBasicsYAxis],[basicsXAxis - 10, topBasicsYAxis - 4],[basicsXAxis, topBasicsYAxis - 8],[basicsXAxis + 10, topBasicsYAxis - 4] ] }, style: { fill: new echarts.graphic.LinearGradient(0, 0, 0, 1, [{ offset: 0, color: \"#387BFE\" },{ offset: 1, color: \"#7CB1FD\" } ]), opacity: 0.8 // 设置半透明 } } ] } } }, { type: \"custom\", name: \"标准容量\", // 手动指定图例颜色 color: \"#1362AC\", data: [0.042, 0.042, 0.042, 0.042, 0.042, 0.042, 0.042, 0.042, 0.042, 0.042], renderItem: (params, api) => { const basicsCoord = api.coord([api.value(0), api.value(1)]) const topBasicsYAxis = basicsCoord[1] const basicsXAxis = basicsCoord[0] + 15 // 向右偏移 15px const bottomYAxis = api.coord([api.value(0), 0])[1] return { type: \"group\", children: [ // 左侧 { type: \"polygon\", shape: { points: [[basicsXAxis - 10, topBasicsYAxis - 4],[basicsXAxis - 10, bottomYAxis],[basicsXAxis, bottomYAxis],[basicsXAxis, topBasicsYAxis] ] }, style: { fill: new echarts.graphic.LinearGradient(0, 0, 0, 1, [{ offset: 0, color: \"#1362AC\" },{ offset: 1, color: \"#1362AC8A\" } ]), opacity: 0.8 // 设置半透明 } }, // 右侧 { type: \"polygon\", shape: { points: [[basicsXAxis, topBasicsYAxis],[basicsXAxis, bottomYAxis],[basicsXAxis + 10, bottomYAxis],[basicsXAxis + 10, topBasicsYAxis - 4] ] }, style: { fill: new echarts.graphic.LinearGradient(0, 0, 0, 1, [{ offset: 0, color: \"#1362AC\" },{ offset: 1, color: \"#1362AC8A\" } ]), opacity: 0.8 // 设置半透明 } }, // 顶部 { type: \"polygon\", shape: { points: [[basicsXAxis, topBasicsYAxis],[basicsXAxis - 10, topBasicsYAxis - 4],[basicsXAxis, topBasicsYAxis - 8],[basicsXAxis + 10, topBasicsYAxis - 4] ] }, style: { fill: new echarts.graphic.LinearGradient(0, 0, 0, 1, [{ offset: 0, color: \"#1362AC\" },{ offset: 1, color: \"#1362AC8A\" } ]), opacity: 0.8 // 设置半透明 } } ] } } } ] } myChart.setOption(option); // 响应窗口大小变化 window.addEventListener(\'resize\', function () { myChart.resize(); }); </script></body></html>6、对话全过程
- 有意思的是第一次识别的时候因为背景有地图,是给提供了mapbox绘制的解决方案

- 去掉地图
- 修改无效的echart在线地址,本文使用的echart地址


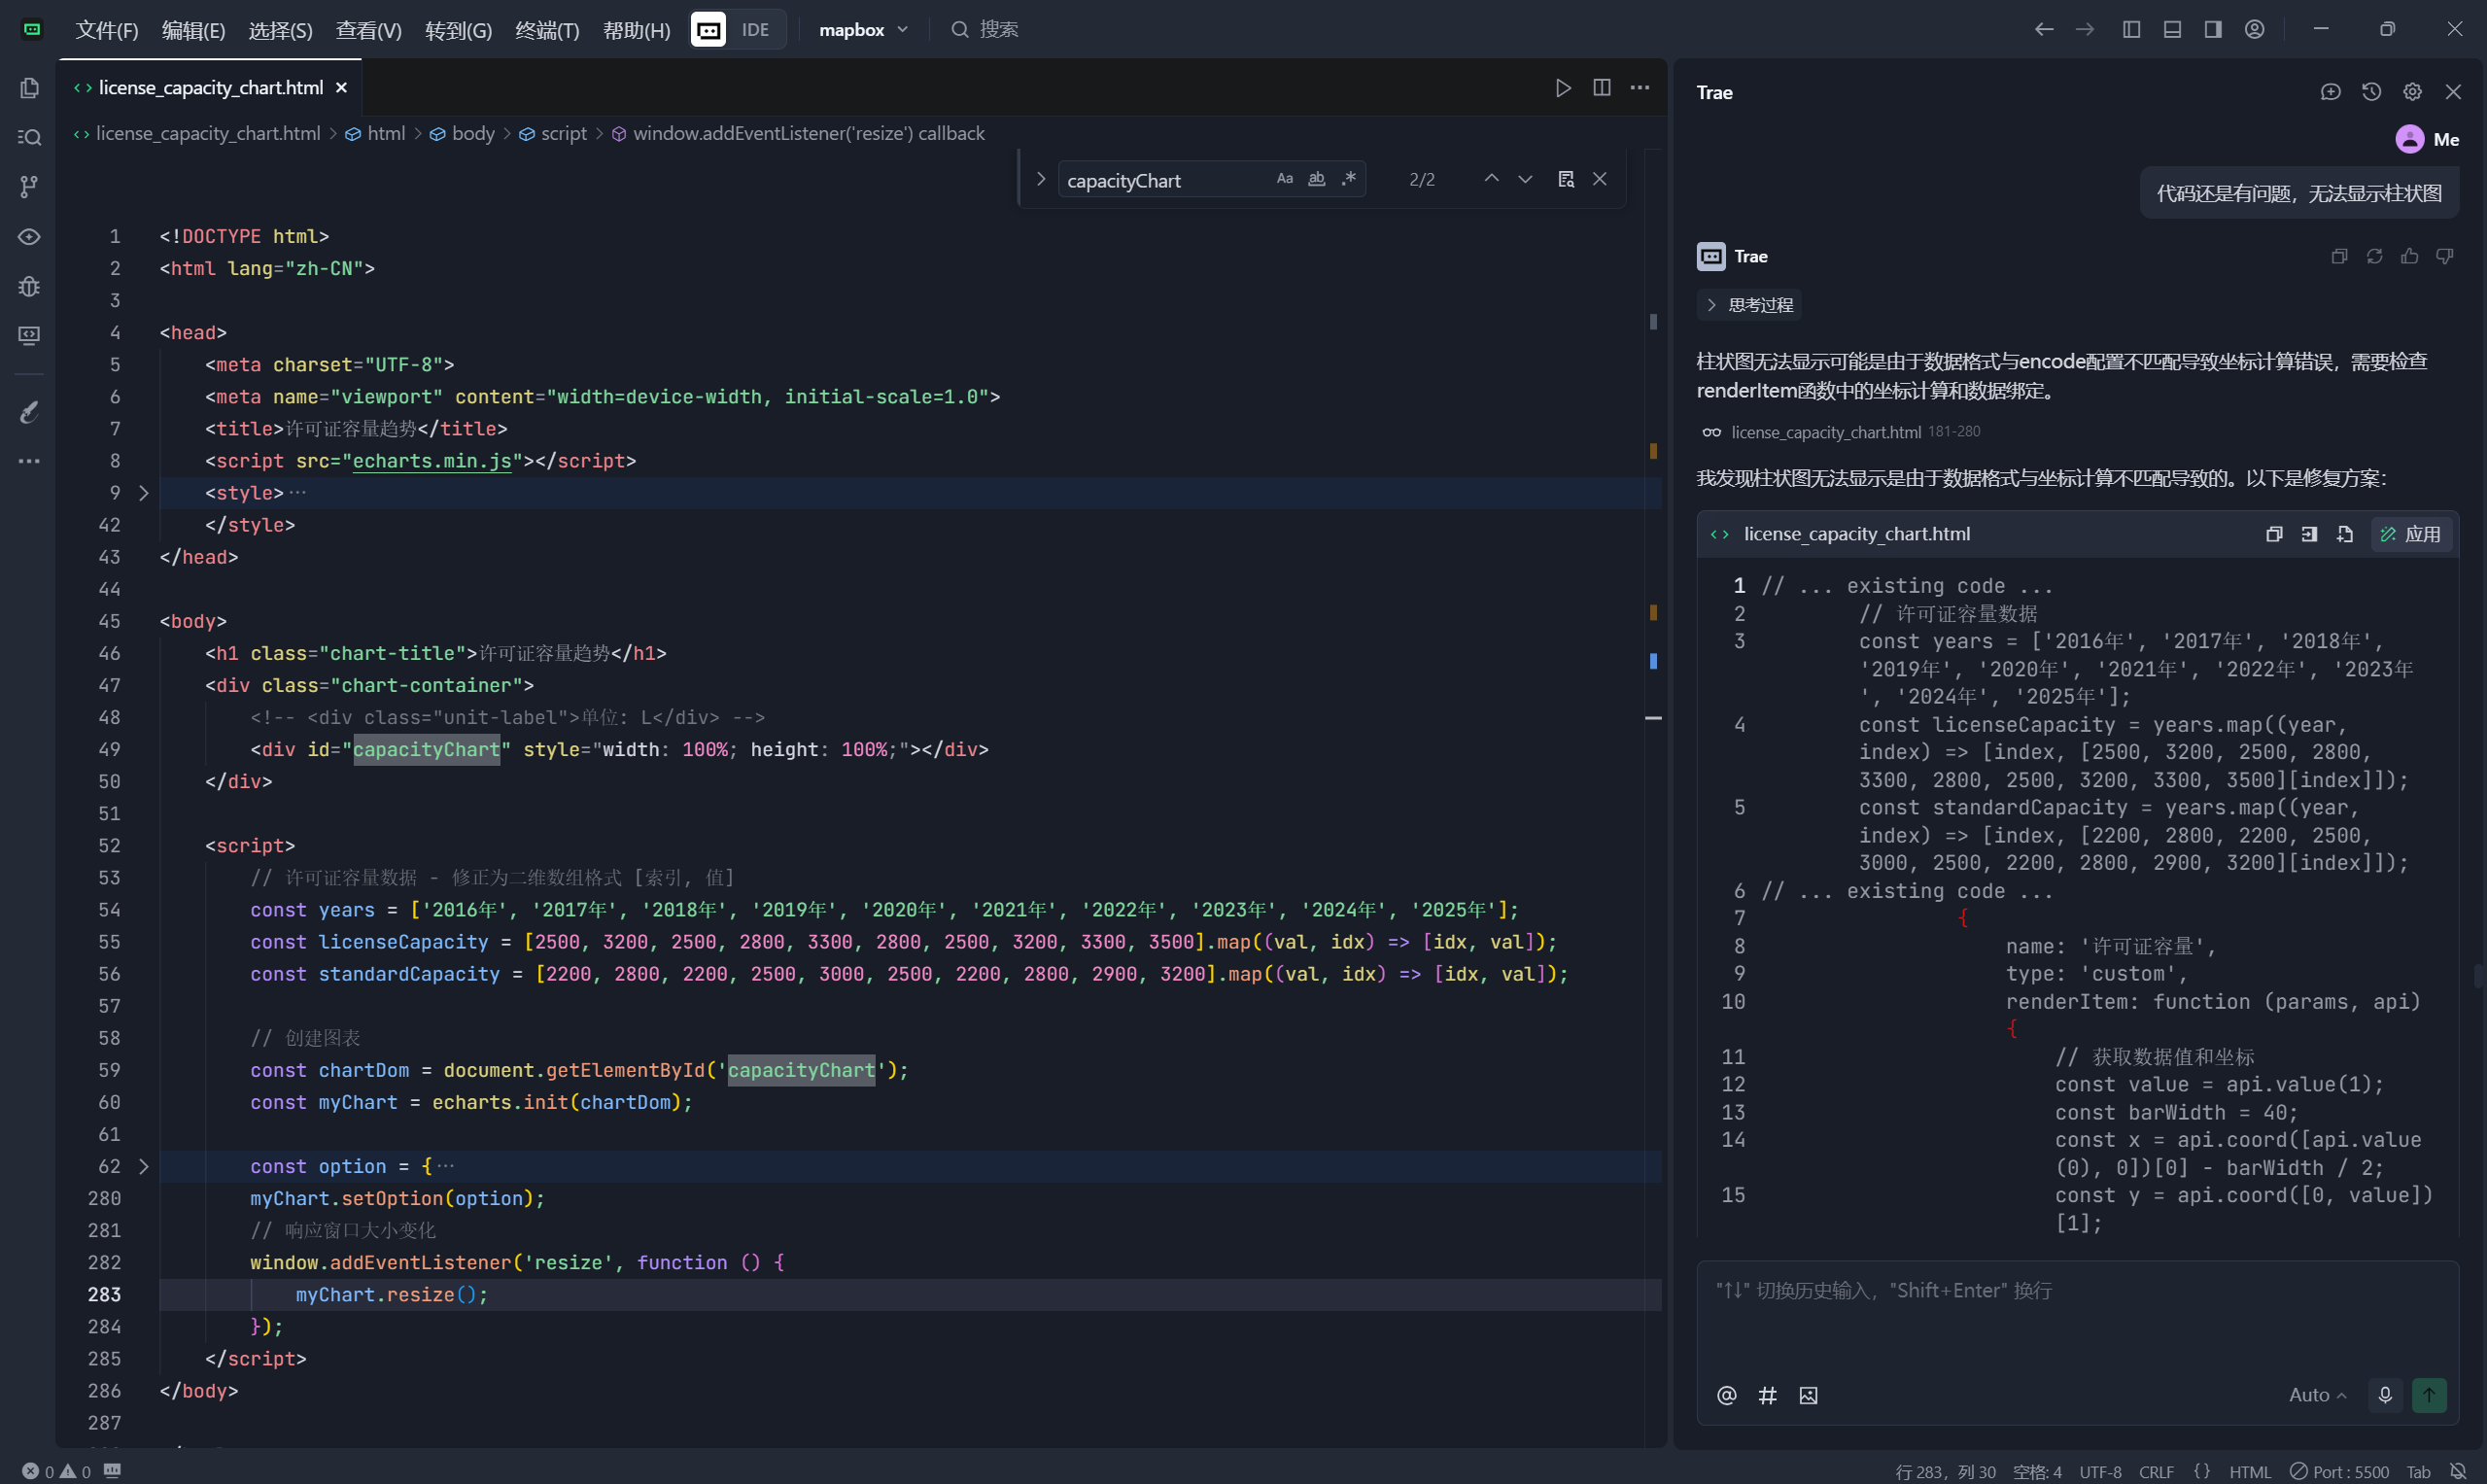
- 第一次生成的是普通的柱状图,不是我想要的立体效果,这个过程我反复了3个来回没有给到关键字,所以效果不明显。
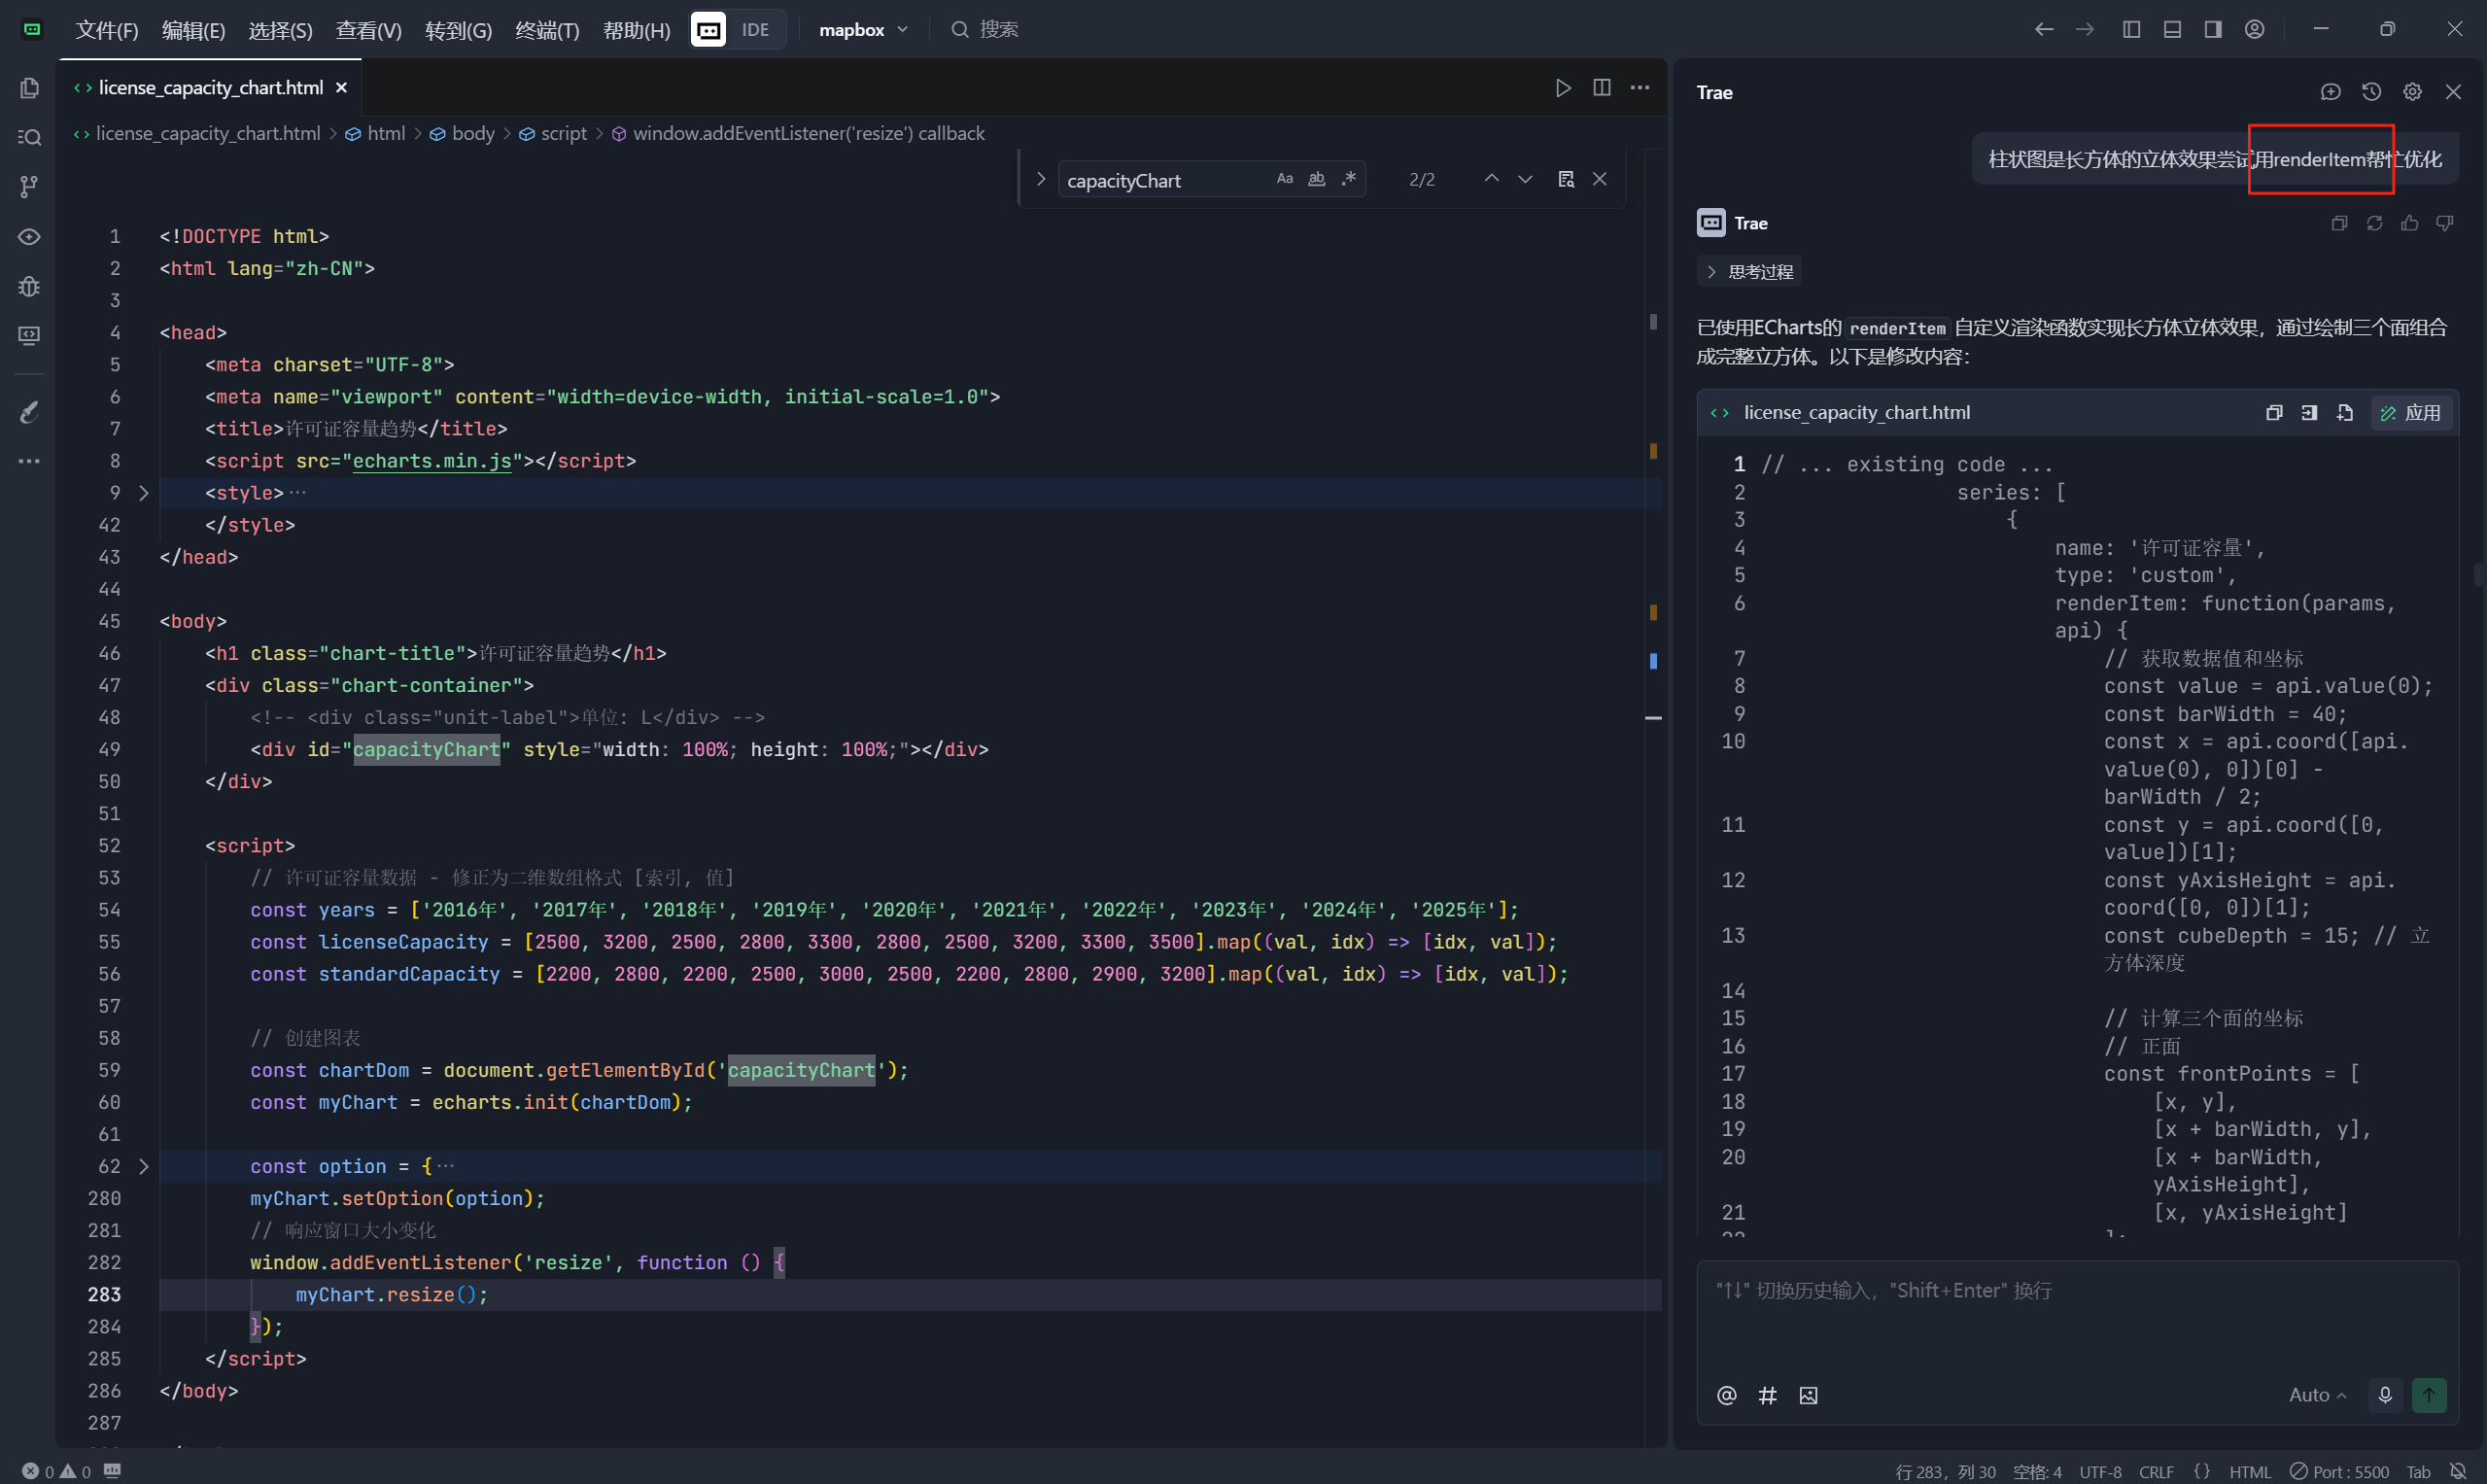
- 再次提交我让他试试renderItem的方式绘制
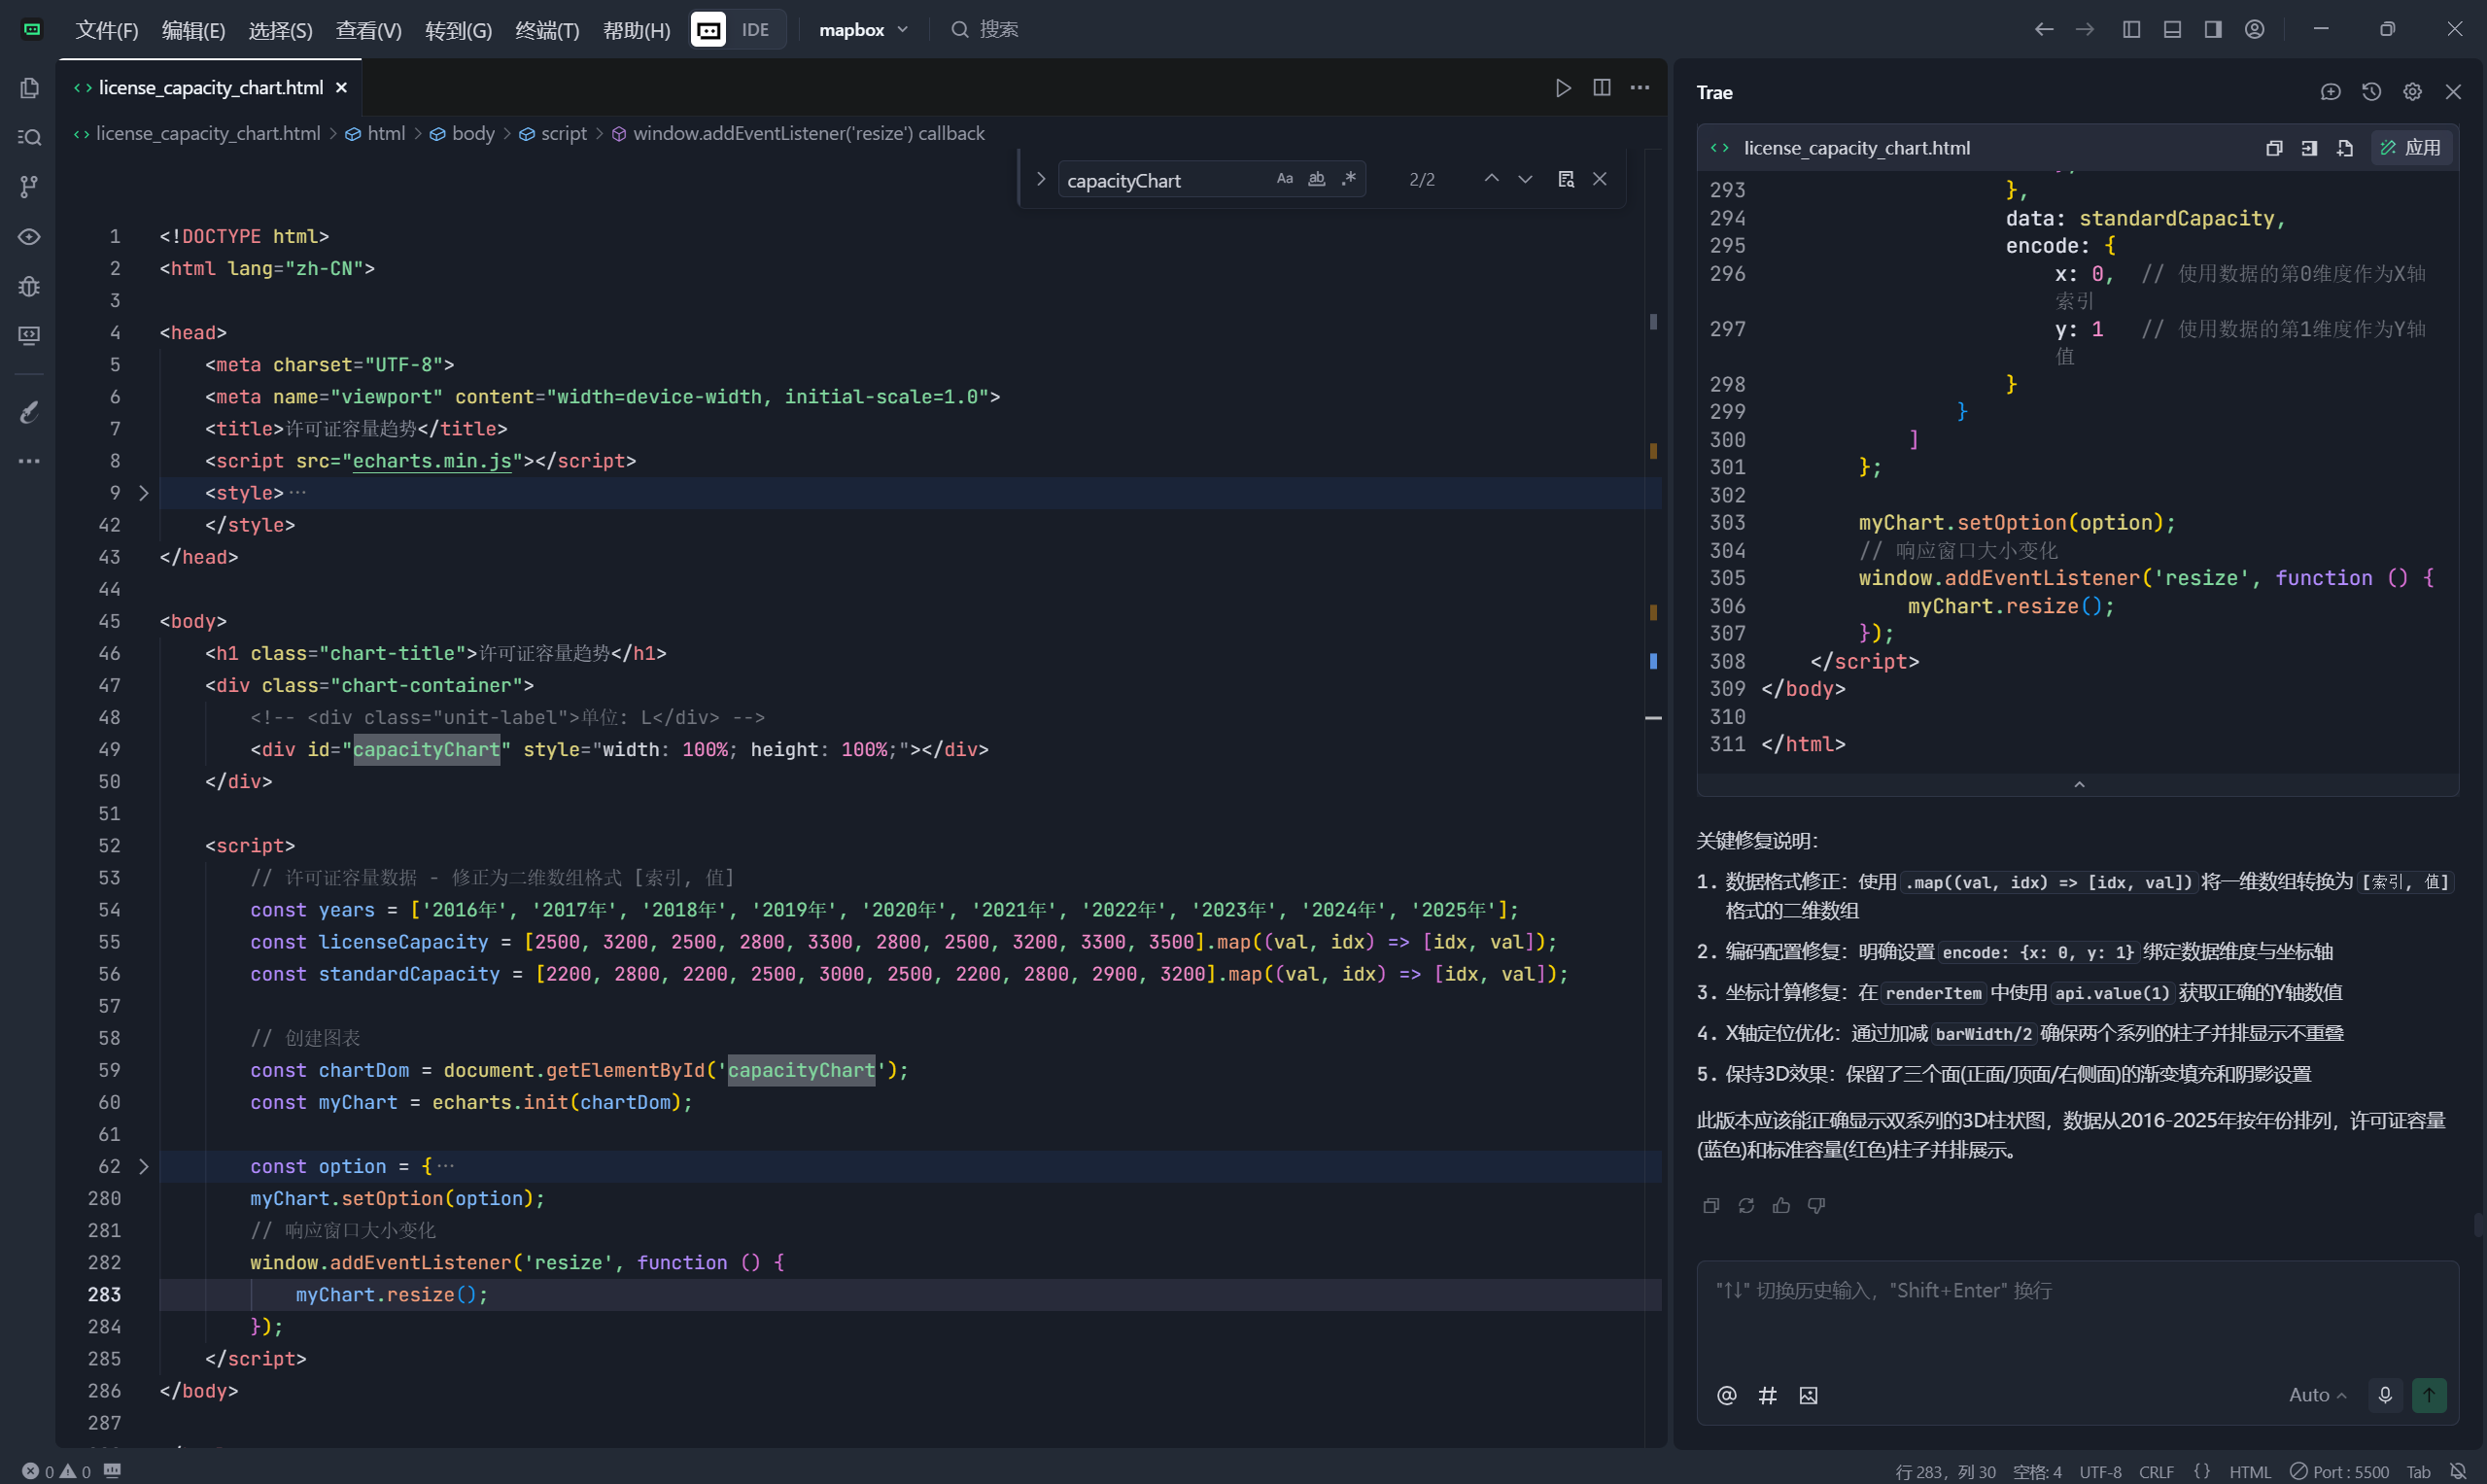
最终就是目录2的效果,当然想实现目录3的效果就是咫尺之间了。使用过程中发现还是需要给一定的关键字才能快速的实现想要的效果,所以目前阶段只能打打辅助还是相当不错的。

